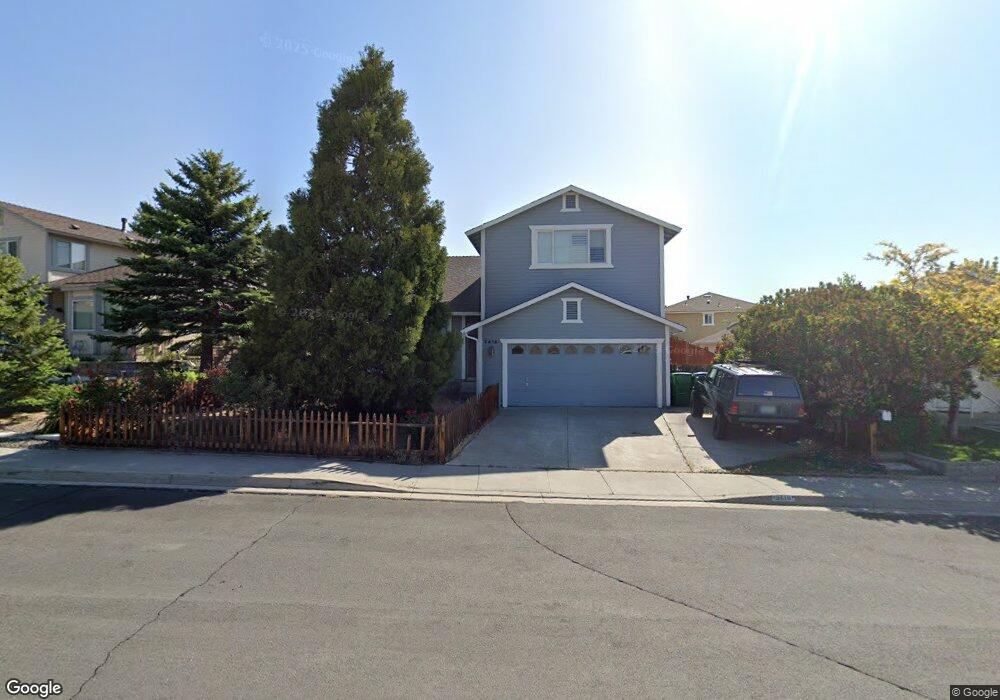
3618 Cambrian Ct Reno, NV 89503
West University NeighborhoodEstimated Value: $354,000 - $588,000
4
Beds
3
Baths
2,100
Sq Ft
$243/Sq Ft
Est. Value
About This Home
This home is located at 3618 Cambrian Ct, Reno, NV 89503 and is currently estimated at $509,340, approximately $242 per square foot. 3618 Cambrian Ct is a home located in Washoe County with nearby schools including Elmcrest Elementary School, Archie Clayton Pre-AP Academy, and Coral Academy Charter School Elementary.
Ownership History
Date
Name
Owned For
Owner Type
Purchase Details
Closed on
Feb 24, 2004
Sold by
Marshall Debra Lynn and Holley Debra Lynn
Bought by
Marshall Robert William and Marshall Debra Lynn
Current Estimated Value
Purchase Details
Closed on
Sep 24, 2001
Sold by
Holley Bobby R and Holley Paula
Bought by
Holley Debra Lynn
Home Financials for this Owner
Home Financials are based on the most recent Mortgage that was taken out on this home.
Original Mortgage
$145,000
Outstanding Balance
$56,841
Interest Rate
6.91%
Estimated Equity
$452,499
Purchase Details
Closed on
Feb 16, 1996
Sold by
Cavallero Ken
Bought by
Holley Bobby R and Holley Paula
Home Financials for this Owner
Home Financials are based on the most recent Mortgage that was taken out on this home.
Original Mortgage
$106,000
Interest Rate
6.99%
Create a Home Valuation Report for This Property
The Home Valuation Report is an in-depth analysis detailing your home's value as well as a comparison with similar homes in the area
Home Values in the Area
Average Home Value in this Area
Purchase History
| Date | Buyer | Sale Price | Title Company |
|---|---|---|---|
| Marshall Robert William | -- | -- | |
| Holley Debra Lynn | $139,500 | First Centennial Title Co | |
| Holley Bobby R | $138,500 | First Centennial Title Co |
Source: Public Records
Mortgage History
| Date | Status | Borrower | Loan Amount |
|---|---|---|---|
| Open | Holley Debra Lynn | $145,000 | |
| Closed | Holley Bobby R | $106,000 |
Source: Public Records
Tax History Compared to Growth
Tax History
| Year | Tax Paid | Tax Assessment Tax Assessment Total Assessment is a certain percentage of the fair market value that is determined by local assessors to be the total taxable value of land and additions on the property. | Land | Improvement |
|---|---|---|---|---|
| 2025 | $2,845 | $107,127 | $40,705 | $66,422 |
| 2024 | $2,845 | $107,181 | $40,145 | $67,036 |
| 2023 | $2,763 | $102,120 | $38,465 | $63,655 |
| 2022 | $2,683 | $84,475 | $31,325 | $53,150 |
| 2021 | $2,605 | $74,525 | $21,420 | $53,105 |
| 2020 | $2,449 | $77,824 | $24,080 | $53,744 |
| 2019 | $2,332 | $73,488 | $21,525 | $51,963 |
| 2018 | $2,226 | $66,610 | $15,645 | $50,965 |
| 2017 | $2,136 | $65,833 | $14,700 | $51,133 |
| 2016 | $2,082 | $66,040 | $13,825 | $52,215 |
| 2015 | $2,078 | $64,385 | $11,340 | $53,045 |
| 2014 | $2,014 | $60,685 | $9,870 | $50,815 |
| 2013 | -- | $50,164 | $7,945 | $42,219 |
Source: Public Records
Map
Nearby Homes
- 785 Talus Way
- 531 Tarn Way
- 3696 Shale Ct
- 400 Tarn Way
- 3200 Lodestar Ln
- 200 Talus Way Unit 232
- 200 Talus Way Unit 234
- 200 Talus Way Unit 522
- 200 Talus Way Unit 123
- 230 Bisset Ct Unit B
- 100 Bisset Ct Unit B
- 5030 Ronald Stephen Cir
- 4795 Ciarra Kennedy Ln
- 585 Logan Jacob Ln
- 147 Vista Rafael Pkwy
- 139 Vista Rafael Pkwy Unit 53
- 4685 Sarah Beth Ln
- 555 Logan Jacob Ln
- 31 Vista Rafael Pkwy
- 27 Vista Rafael Pkwy
- 3628 Cambrian Ct
- 3608 Cambrian Ct
- 661 Talus Way
- 3638 Cambrian Ct
- 651 Talus Way
- 705 Talus Way
- 3621 Cambrian Way
- 3648 Cambrian Ct
- 641 Talus Way
- 3629 Cambrian Ct
- 692 Talus Way
- 3621 Cambrian Ct
- 682 Talus Way
- 702 Talus Way
- 715 Talus Way
- 3633 Cambrian Ct
- 662 Talus Way
- 635 Talus Way
- 652 Talus Way
- 3639 Cambrian Ct