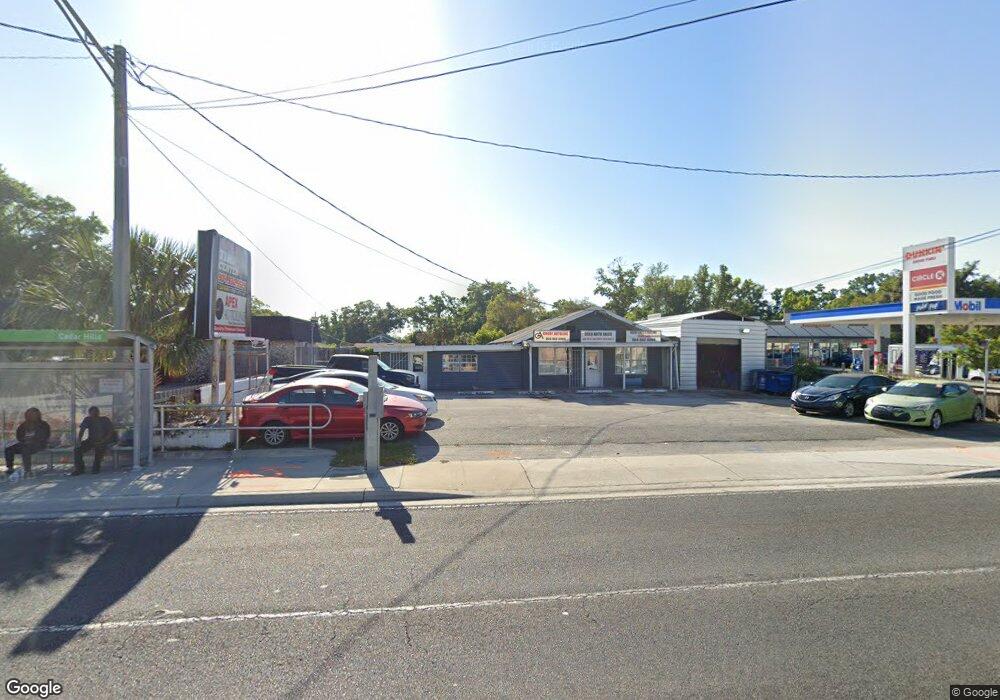
3619 Blanding Blvd Jacksonville, FL 32210
Cedar Hills NeighborhoodEstimated Value: $230,120
--
Bed
4
Baths
2,494
Sq Ft
$92/Sq Ft
Est. Value
About This Home
This home is located at 3619 Blanding Blvd, Jacksonville, FL 32210 and is currently estimated at $230,120, approximately $92 per square foot. 3619 Blanding Blvd is a home located in Duval County with nearby schools including Hidden Oaks Elementary, Westside Middle School, and Portola High School.
Ownership History
Date
Name
Owned For
Owner Type
Purchase Details
Closed on
Feb 14, 2020
Sold by
Goudarzi Arastou
Bought by
Rezagholi Roohallah and Khorrami Shayan
Current Estimated Value
Home Financials for this Owner
Home Financials are based on the most recent Mortgage that was taken out on this home.
Original Mortgage
$120,000
Interest Rate
3.6%
Mortgage Type
Seller Take Back
Purchase Details
Closed on
Feb 11, 2020
Sold by
Goudarzi Arastou and Goudarzi Neda
Bought by
Goudarzi Arastou
Home Financials for this Owner
Home Financials are based on the most recent Mortgage that was taken out on this home.
Original Mortgage
$120,000
Interest Rate
3.6%
Mortgage Type
Seller Take Back
Purchase Details
Closed on
Jul 14, 2011
Sold by
Vartanian David and Vartanian Cynthia D
Bought by
Goudarzi Arastou and Goudarzi Neda
Purchase Details
Closed on
Aug 4, 2010
Sold by
Vartanian David
Bought by
Vartanian David and Vartanian Cynthia D
Create a Home Valuation Report for This Property
The Home Valuation Report is an in-depth analysis detailing your home's value as well as a comparison with similar homes in the area
Home Values in the Area
Average Home Value in this Area
Purchase History
| Date | Buyer | Sale Price | Title Company |
|---|---|---|---|
| Rezagholi Roohallah | $150,000 | Attorney | |
| Goudarzi Arastou | -- | Attorney | |
| Goudarzi Arastou | $220,000 | Attorney | |
| Vartanian David | $41,500 | Attorney |
Source: Public Records
Mortgage History
| Date | Status | Borrower | Loan Amount |
|---|---|---|---|
| Closed | Rezagholi Roohallah | $120,000 |
Source: Public Records
Tax History Compared to Growth
Tax History
| Year | Tax Paid | Tax Assessment Tax Assessment Total Assessment is a certain percentage of the fair market value that is determined by local assessors to be the total taxable value of land and additions on the property. | Land | Improvement |
|---|---|---|---|---|
| 2025 | $3,158 | $177,600 | $89,276 | $88,324 |
| 2024 | $3,071 | $177,500 | $71,230 | $106,270 |
| 2023 | $3,071 | $188,300 | $64,755 | $123,545 |
| 2022 | $2,452 | $136,000 | $64,755 | $71,245 |
| 2021 | $2,455 | $132,500 | $64,755 | $67,745 |
| 2020 | $2,586 | $137,100 | $64,755 | $72,345 |
| 2019 | $4,015 | $215,100 | $64,755 | $150,345 |
| 2018 | $4,099 | $217,900 | $66,000 | $151,900 |
| 2017 | $3,879 | $212,400 | $66,000 | $146,400 |
| 2016 | $3,519 | $180,300 | $0 | $0 |
| 2015 | $3,579 | $180,300 | $0 | $0 |
| 2014 | $3,700 | $184,700 | $0 | $0 |
Source: Public Records
Map
Nearby Homes
- 5779 Cedar Forest Dr N
- 5757 Cedar Park Ln
- 5749 Cedar Park Ln
- 3766 Cedarcrest Dr
- 2467 Ormsby Cir E
- 3434 Blanding Blvd Unit 101
- 3434 Blanding Blvd Unit 124
- 3434 Blanding Blvd Unit 201
- 3434 Blanding Blvd Unit 215
- 3434 Blanding Blvd Unit 236
- 3434 Blanding Blvd Unit 228
- 3434 Blanding Blvd Unit 116
- 3434 Blanding Blvd Unit 207
- 3434 Blanding Blvd Unit 240
- 3434 Blanding Blvd Unit 212
- 3434 Blanding Blvd Unit 241
- 3434 Blanding Blvd Unit 145
- 6014 Woodside Dr
- 6013 Woodside Dr
- 6055 Wilson Blvd
- 5782 Richmond Rd
- 5772 Richmond Rd
- 3701 Blanding Blvd
- 5762 Richmond Rd
- 5765 Richmond Rd
- 5773 Wilson Blvd
- 5752 Richmond Rd
- 5747 Adair Cir
- 5765 Wilson Blvd
- 5751 Richmond Rd
- 5755 Wilson Blvd
- 5742 Richmond Rd
- 5766 Cedar Park Ln
- 5749 Wilson Blvd
- 3520 Blanding Blvd
- 5741 Richmond Rd
- 5769 Cedar Forest Dr N
- 5735 Adair Cir
- 5760 Cedar Park Ln
- 5736 Wilson Blvd