Estimated Value: $124,000 - $150,000
2
Beds
1
Bath
1,380
Sq Ft
$102/Sq Ft
Est. Value
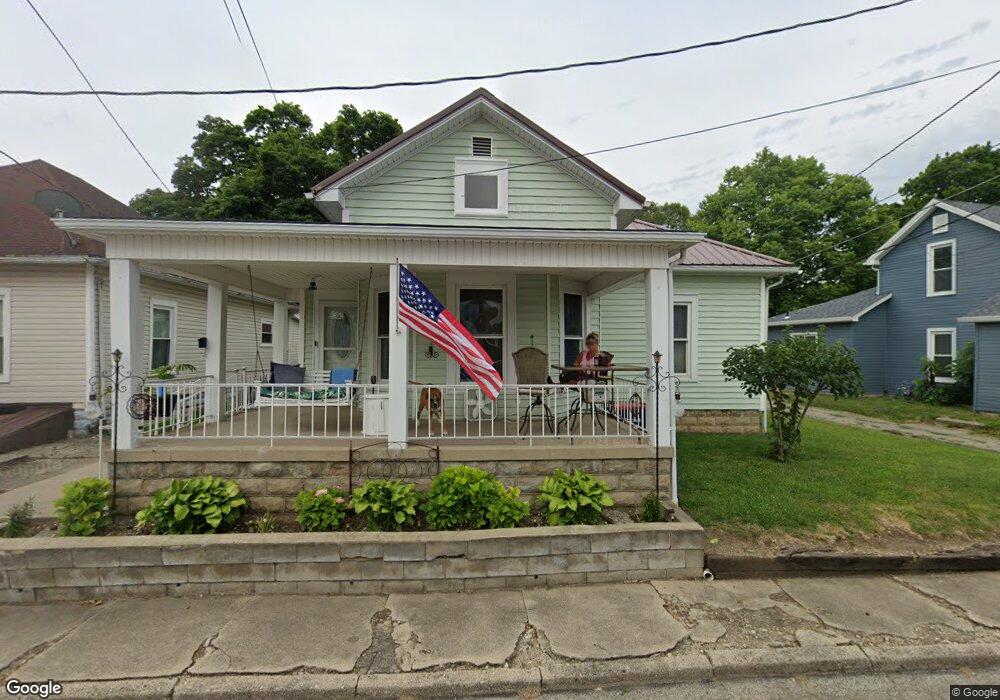
About This Home
This home is located at 362 Ellerman St, Piqua, OH 45356 and is currently estimated at $140,386, approximately $101 per square foot. 362 Ellerman St is a home located in Miami County with nearby schools including Piqua Junior High School, Piqua High School, and Nicholas School.
Ownership History
Date
Name
Owned For
Owner Type
Purchase Details
Closed on
Oct 29, 2012
Sold by
Fannie Mae
Bought by
Bubeck Angela
Current Estimated Value
Home Financials for this Owner
Home Financials are based on the most recent Mortgage that was taken out on this home.
Original Mortgage
$47,400
Outstanding Balance
$32,723
Interest Rate
3.37%
Mortgage Type
New Conventional
Estimated Equity
$107,663
Purchase Details
Closed on
Sep 4, 2012
Sold by
Kindell Thomas E
Bought by
Federal National Mortgage Association
Home Financials for this Owner
Home Financials are based on the most recent Mortgage that was taken out on this home.
Original Mortgage
$47,400
Outstanding Balance
$32,723
Interest Rate
3.37%
Mortgage Type
New Conventional
Estimated Equity
$107,663
Purchase Details
Closed on
Aug 15, 2012
Sold by
Kindell Thomas E and Kindell Rose M
Bought by
Federal National Mortgage Association
Purchase Details
Closed on
Mar 1, 1978
Bought by
Kindell Thomas
Create a Home Valuation Report for This Property
The Home Valuation Report is an in-depth analysis detailing your home's value as well as a comparison with similar homes in the area
Home Values in the Area
Average Home Value in this Area
Purchase History
| Date | Buyer | Sale Price | Title Company |
|---|---|---|---|
| Bubeck Angela | $49,000 | Titlemasters | |
| Federal National Mortgage Association | $44,000 | None Available | |
| Federal National Mortgage Association | $44,000 | None Available | |
| Kindell Thomas | $25,000 | -- |
Source: Public Records
Mortgage History
| Date | Status | Borrower | Loan Amount |
|---|---|---|---|
| Open | Bubeck Angela | $47,400 |
Source: Public Records
Tax History Compared to Growth
Tax History
| Year | Tax Paid | Tax Assessment Tax Assessment Total Assessment is a certain percentage of the fair market value that is determined by local assessors to be the total taxable value of land and additions on the property. | Land | Improvement |
|---|---|---|---|---|
| 2024 | $1,114 | $27,100 | $5,920 | $21,180 |
| 2023 | $1,114 | $27,100 | $5,920 | $21,180 |
| 2022 | $1,133 | $27,100 | $5,920 | $21,180 |
| 2021 | $917 | $20,060 | $4,380 | $15,680 |
| 2020 | $899 | $20,060 | $4,380 | $15,680 |
| 2019 | $904 | $20,060 | $4,380 | $15,680 |
| 2018 | $857 | $18,170 | $4,380 | $13,790 |
| 2017 | $868 | $18,170 | $4,380 | $13,790 |
| 2016 | $858 | $18,170 | $4,380 | $13,790 |
| 2015 | $844 | $17,470 | $4,200 | $13,270 |
| 2014 | $844 | $17,470 | $4,200 | $13,270 |
| 2013 | $847 | $17,470 | $4,200 | $13,270 |
Source: Public Records
Map
Nearby Homes