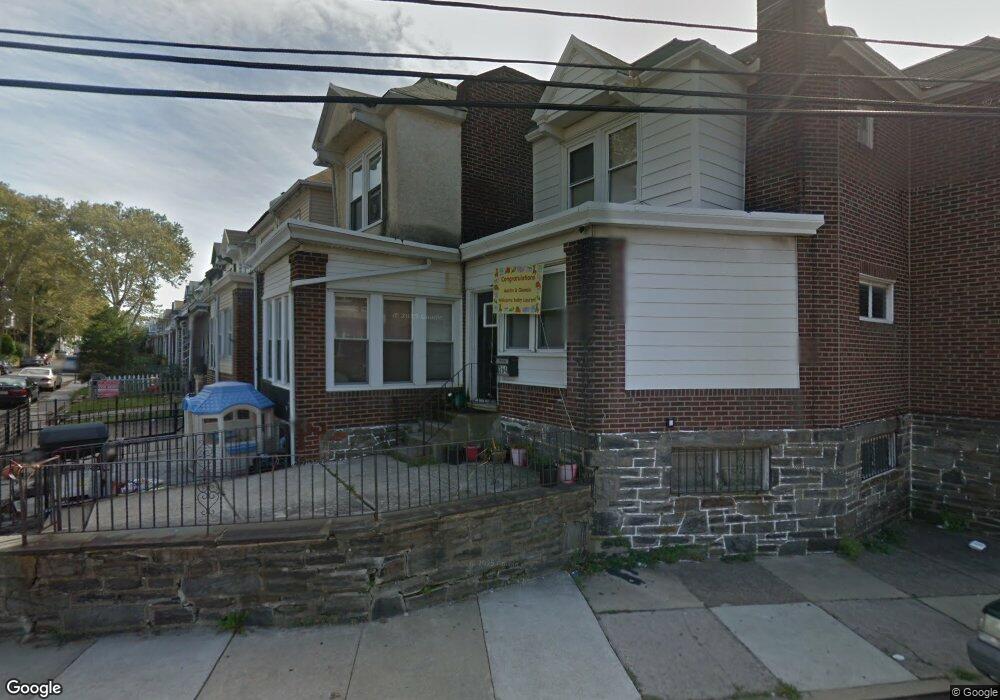
362 Huntley Rd Upper Darby, PA 19082
Estimated Value: $188,376 - $222,000
3
Beds
1
Bath
1,346
Sq Ft
$158/Sq Ft
Est. Value
About This Home
This home is located at 362 Huntley Rd, Upper Darby, PA 19082 and is currently estimated at $212,594, approximately $157 per square foot. 362 Huntley Rd is a home located in Delaware County with nearby schools including Bywood Elementary School, Upper Darby Kdg Center, and Upper Darby High School.
Ownership History
Date
Name
Owned For
Owner Type
Purchase Details
Closed on
Sep 10, 2021
Sold by
Chowdhury Lutfor H
Bought by
Smith Nakisha M
Current Estimated Value
Home Financials for this Owner
Home Financials are based on the most recent Mortgage that was taken out on this home.
Original Mortgage
$144,337
Interest Rate
2.99%
Mortgage Type
FHA
Purchase Details
Closed on
Jun 19, 2006
Sold by
Karyaquos Magdy
Bought by
Chowdhury Lutfor H
Home Financials for this Owner
Home Financials are based on the most recent Mortgage that was taken out on this home.
Original Mortgage
$76,800
Interest Rate
6.25%
Mortgage Type
Purchase Money Mortgage
Purchase Details
Closed on
Feb 17, 2006
Sold by
Mcwilliams Richard S and Mcwilliams Maureen R
Bought by
Karyaquos Magdy
Create a Home Valuation Report for This Property
The Home Valuation Report is an in-depth analysis detailing your home's value as well as a comparison with similar homes in the area
Home Values in the Area
Average Home Value in this Area
Purchase History
| Date | Buyer | Sale Price | Title Company |
|---|---|---|---|
| Smith Nakisha M | $151,000 | Go Abstract Services Llc | |
| Chowdhury Lutfor H | $96,000 | None Available | |
| Karyaquos Magdy | $74,000 | None Available |
Source: Public Records
Mortgage History
| Date | Status | Borrower | Loan Amount |
|---|---|---|---|
| Open | Smith Nakisha M | $7,350 | |
| Previous Owner | Smith Nakisha M | $144,337 | |
| Previous Owner | Chowdhury Lutfor H | $76,800 |
Source: Public Records
Tax History
| Year | Tax Paid | Tax Assessment Tax Assessment Total Assessment is a certain percentage of the fair market value that is determined by local assessors to be the total taxable value of land and additions on the property. | Land | Improvement |
|---|---|---|---|---|
| 2025 | $3,584 | $84,750 | $22,200 | $62,550 |
| 2024 | $3,584 | $84,750 | $22,200 | $62,550 |
| 2023 | $3,550 | $84,750 | $22,200 | $62,550 |
| 2022 | $3,455 | $84,750 | $22,200 | $62,550 |
| 2021 | $4,659 | $84,750 | $22,200 | $62,550 |
| 2020 | $3,277 | $50,660 | $17,270 | $33,390 |
| 2019 | $3,219 | $50,660 | $17,270 | $33,390 |
| 2018 | $3,182 | $50,660 | $0 | $0 |
| 2017 | $3,100 | $50,660 | $0 | $0 |
| 2016 | $278 | $50,660 | $0 | $0 |
| 2015 | $278 | $50,660 | $0 | $0 |
| 2014 | $278 | $50,660 | $0 | $0 |
Source: Public Records
Map
Nearby Homes
- 232 Copley Rd
- 210 Copley Rd
- 212 Copley Rd
- 232 Long Ln
- 234 Long Ln
- 207 Avon Rd
- 212 Huntley Rd
- 337 Copley Rd
- 345 Copley Rd
- 138 Richfield Rd
- 274 Avon Rd
- 334 Wiltshire Rd
- 116 Richfield Rd
- 244 Wembly Rd
- 7283 Bradford Rd
- 432 Grace Rd
- 418 Hampden Rd
- 7281 Walnut St
- 418 Littlecroft Rd Unit 6A
- 411 Millbank Rd
Your Personal Tour Guide
Ask me questions while you tour the home.