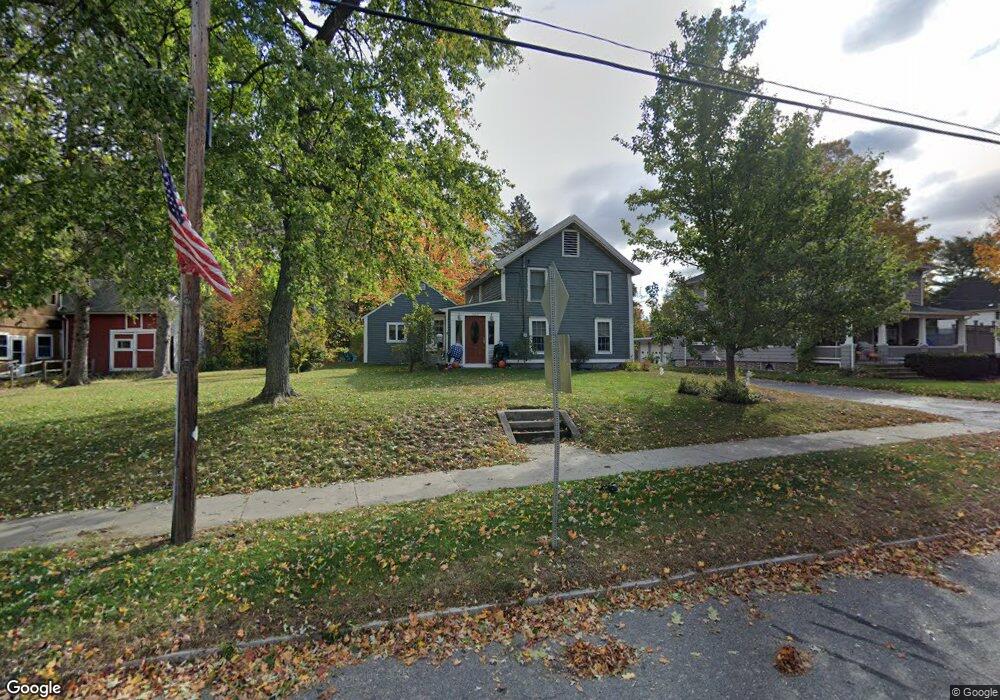
362 Main St Oxford, MA 01540
Estimated Value: $288,000 - $408,000
4
Beds
1
Bath
1,519
Sq Ft
$234/Sq Ft
Est. Value
About This Home
This home is located at 362 Main St, Oxford, MA 01540 and is currently estimated at $355,067, approximately $233 per square foot. 362 Main St is a home located in Worcester County with nearby schools including Alfred M Chaffee, Oxford High School, and Clara Barton Elementary School.
Ownership History
Date
Name
Owned For
Owner Type
Purchase Details
Closed on
Mar 18, 2004
Sold by
Gaspie Charles E and Gaspie Patricia E
Bought by
Mayo Kevin M and Mayo Kimberly G
Current Estimated Value
Home Financials for this Owner
Home Financials are based on the most recent Mortgage that was taken out on this home.
Original Mortgage
$127,200
Outstanding Balance
$59,614
Interest Rate
5.71%
Mortgage Type
Purchase Money Mortgage
Estimated Equity
$295,453
Create a Home Valuation Report for This Property
The Home Valuation Report is an in-depth analysis detailing your home's value as well as a comparison with similar homes in the area
Home Values in the Area
Average Home Value in this Area
Purchase History
| Date | Buyer | Sale Price | Title Company |
|---|---|---|---|
| Mayo Kevin M | $159,000 | -- |
Source: Public Records
Mortgage History
| Date | Status | Borrower | Loan Amount |
|---|---|---|---|
| Open | Mayo Kevin M | $127,200 |
Source: Public Records
Tax History Compared to Growth
Tax History
| Year | Tax Paid | Tax Assessment Tax Assessment Total Assessment is a certain percentage of the fair market value that is determined by local assessors to be the total taxable value of land and additions on the property. | Land | Improvement |
|---|---|---|---|---|
| 2025 | $40 | $314,600 | $89,400 | $225,200 |
| 2024 | $3,889 | $288,500 | $83,000 | $205,500 |
| 2023 | $3,870 | $283,700 | $74,100 | $209,600 |
| 2022 | $3,652 | $226,000 | $65,400 | $160,600 |
| 2021 | $3,422 | $207,000 | $62,100 | $144,900 |
| 2020 | $3,197 | $191,900 | $62,100 | $129,800 |
| 2019 | $2,735 | $160,600 | $62,100 | $98,500 |
| 2018 | $2,774 | $160,600 | $62,100 | $98,500 |
| 2017 | $2,780 | $165,000 | $62,100 | $102,900 |
| 2016 | $2,793 | $165,000 | $62,100 | $102,900 |
| 2015 | $2,605 | $165,000 | $62,100 | $102,900 |
| 2014 | $2,564 | $170,900 | $62,100 | $108,800 |
Source: Public Records
Map
Nearby Homes