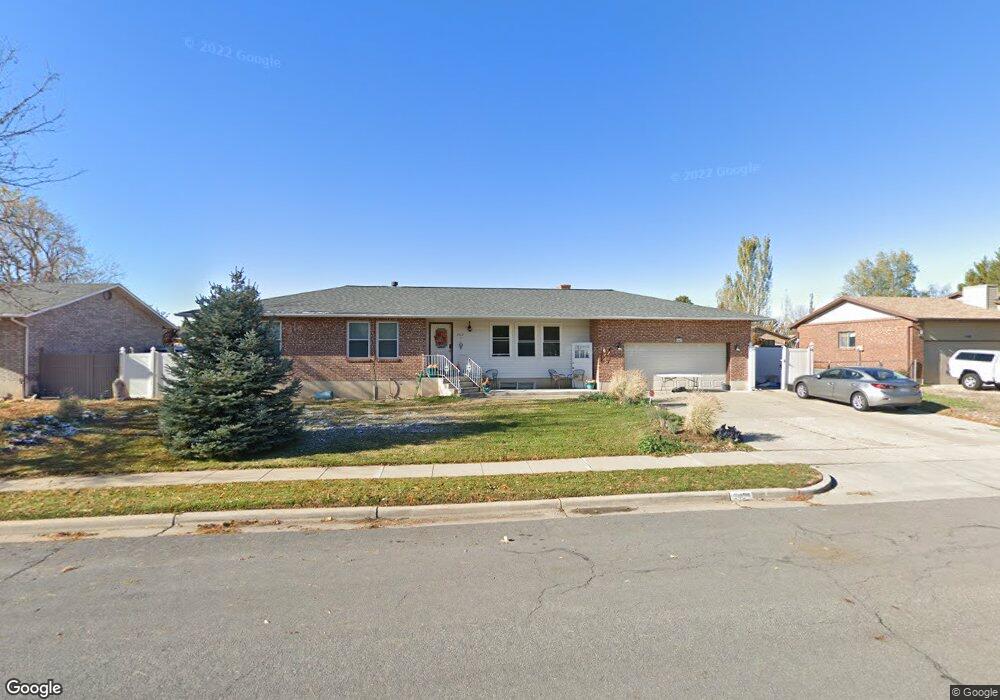
362 S 750 E Layton, UT 84041
Estimated Value: $529,000 - $619,000
5
Beds
3
Baths
3,032
Sq Ft
$186/Sq Ft
Est. Value
About This Home
This home is located at 362 S 750 E, Layton, UT 84041 and is currently estimated at $563,117, approximately $185 per square foot. 362 S 750 E is a home located in Davis County with nearby schools including Whitesides Elementary School, Fairfield Junior High School, and Layton High School.
Ownership History
Date
Name
Owned For
Owner Type
Purchase Details
Closed on
Oct 22, 2012
Sold by
Ropp John D
Bought by
Ropp John D and Ropp Tanaya L
Current Estimated Value
Purchase Details
Closed on
Aug 28, 2012
Sold by
Johnsen Chris C
Bought by
Ropp John D
Purchase Details
Closed on
Apr 28, 2008
Sold by
Bennett Danny
Bought by
Ropp John D and Johnsen Chris C
Home Financials for this Owner
Home Financials are based on the most recent Mortgage that was taken out on this home.
Original Mortgage
$242,199
Interest Rate
6.11%
Mortgage Type
FHA
Purchase Details
Closed on
Dec 17, 1997
Sold by
Ho Peter and Nguyen Hanh Huu
Bought by
Bennett Danny
Home Financials for this Owner
Home Financials are based on the most recent Mortgage that was taken out on this home.
Original Mortgage
$128,000
Interest Rate
7.23%
Create a Home Valuation Report for This Property
The Home Valuation Report is an in-depth analysis detailing your home's value as well as a comparison with similar homes in the area
Home Values in the Area
Average Home Value in this Area
Purchase History
| Date | Buyer | Sale Price | Title Company |
|---|---|---|---|
| Ropp John D | -- | Accommodation | |
| Ropp John D | -- | Accommodation | |
| Ropp John D | -- | Us Title Company Of Utah | |
| Bennett Danny | -- | Associated Title Company |
Source: Public Records
Mortgage History
| Date | Status | Borrower | Loan Amount |
|---|---|---|---|
| Previous Owner | Ropp John D | $242,199 | |
| Previous Owner | Bennett Danny | $128,000 |
Source: Public Records
Tax History
| Year | Tax Paid | Tax Assessment Tax Assessment Total Assessment is a certain percentage of the fair market value that is determined by local assessors to be the total taxable value of land and additions on the property. | Land | Improvement |
|---|---|---|---|---|
| 2025 | $2,683 | $281,600 | $107,144 | $174,456 |
| 2024 | $2,575 | $272,250 | $124,529 | $147,721 |
| 2023 | $2,457 | $458,000 | $145,155 | $312,845 |
| 2022 | $2,570 | $260,150 | $77,605 | $182,545 |
| 2021 | $2,491 | $376,000 | $111,167 | $264,833 |
| 2020 | $2,217 | $321,000 | $92,563 | $228,437 |
| 2019 | $2,157 | $306,000 | $87,033 | $218,967 |
| 2018 | $1,980 | $282,000 | $87,033 | $194,967 |
| 2016 | $1,748 | $128,370 | $28,436 | $99,934 |
| 2015 | $1,679 | $117,095 | $28,436 | $88,659 |
| 2014 | $1,753 | $125,010 | $28,436 | $96,574 |
| 2013 | -- | $107,856 | $21,739 | $86,117 |
Source: Public Records
Map
Nearby Homes
- 617 E 405 S
- 389 Morgan St
- 504 E Alice Way
- 464 E Alice Way
- 86 Mill Rd
- 679 S Clearwater Falls Dr
- 9 Colonial Ave
- 706 S 600 E
- 282 E 925 S
- 811 S Main St
- 753 S 300 E
- 948 S 250 E
- 949 S 225 E
- 623 E Clearwater Dr Unit 15
- 189 S Main St Unit 76
- 189 S Main St Unit 21
- 149 N Fort Ln Unit 1D
- 680 N Main St Trlr E-11
- 772 N Crimson Ln
- 895 S Main St Unit E
Your Personal Tour Guide
Ask me questions while you tour the home.