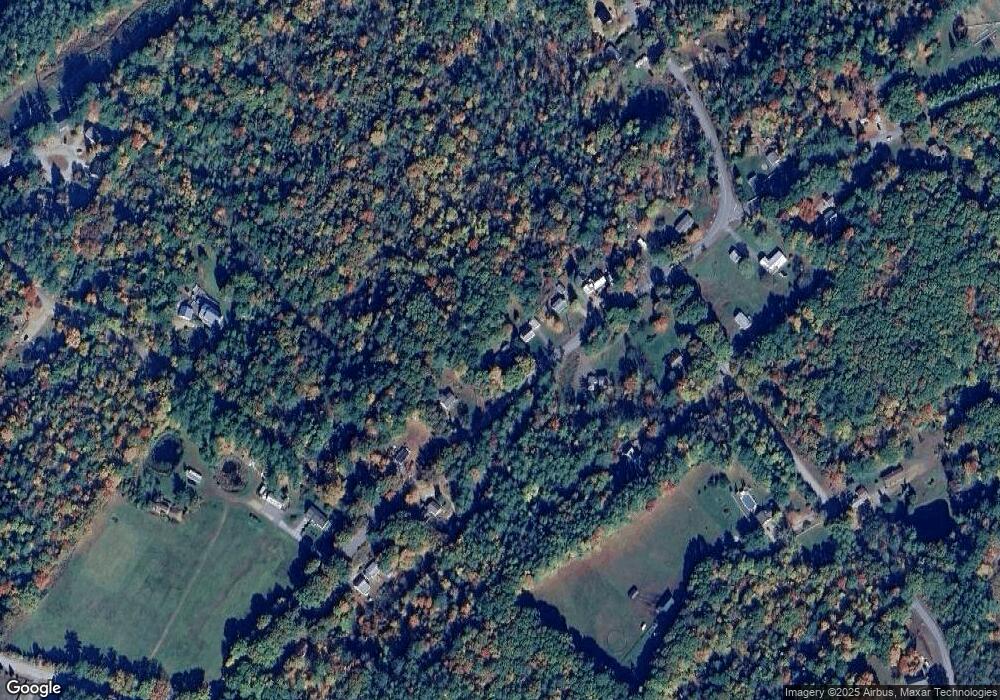
362 Union Rd Belmont, NH 03220
Estimated Value: $401,339 - $517,000
3
Beds
1
Bath
1,204
Sq Ft
$372/Sq Ft
Est. Value
About This Home
This home is located at 362 Union Rd, Belmont, NH 03220 and is currently estimated at $447,585, approximately $371 per square foot. 362 Union Rd is a home located in Belknap County with nearby schools including Belmont Elementary School, Belmont Middle School, and Belmont High School.
Ownership History
Date
Name
Owned For
Owner Type
Purchase Details
Closed on
Sep 29, 2004
Sold by
Andrea Alexis R
Bought by
Elliot Richard H and Elliot Elsbeth M
Current Estimated Value
Home Financials for this Owner
Home Financials are based on the most recent Mortgage that was taken out on this home.
Original Mortgage
$166,155
Outstanding Balance
$82,509
Interest Rate
5.81%
Mortgage Type
Purchase Money Mortgage
Estimated Equity
$365,076
Purchase Details
Closed on
Sep 1, 1999
Sold by
Klose Philip and Klose Susan
Bought by
Andre Alexia
Home Financials for this Owner
Home Financials are based on the most recent Mortgage that was taken out on this home.
Original Mortgage
$85,500
Interest Rate
7.5%
Create a Home Valuation Report for This Property
The Home Valuation Report is an in-depth analysis detailing your home's value as well as a comparison with similar homes in the area
Home Values in the Area
Average Home Value in this Area
Purchase History
| Date | Buyer | Sale Price | Title Company |
|---|---|---|---|
| Elliot Richard H | $169,900 | -- | |
| Andre Alexia | $95,000 | -- |
Source: Public Records
Mortgage History
| Date | Status | Borrower | Loan Amount |
|---|---|---|---|
| Open | Andre Alexia | $166,155 | |
| Previous Owner | Andre Alexia | $85,500 |
Source: Public Records
Tax History Compared to Growth
Tax History
| Year | Tax Paid | Tax Assessment Tax Assessment Total Assessment is a certain percentage of the fair market value that is determined by local assessors to be the total taxable value of land and additions on the property. | Land | Improvement |
|---|---|---|---|---|
| 2024 | $5,226 | $332,000 | $73,400 | $258,600 |
| 2023 | $5,250 | $300,500 | $56,300 | $244,200 |
| 2022 | $5,250 | $274,700 | $48,800 | $225,900 |
| 2021 | $4,582 | $171,800 | $35,900 | $135,900 |
| 2020 | $29,904 | $171,800 | $35,900 | $135,900 |
| 2019 | $31,010 | $171,800 | $35,900 | $135,900 |
| 2017 | $2,050 | $135,700 | $36,600 | $99,100 |
| 2016 | $2,012 | $135,700 | $36,600 | $99,100 |
| 2015 | $3,836 | $135,700 | $36,600 | $99,100 |
| 2014 | $3,752 | $135,700 | $36,600 | $99,100 |
| 2013 | $3,882 | $173,000 | $64,400 | $108,600 |
Source: Public Records
Map
Nearby Homes