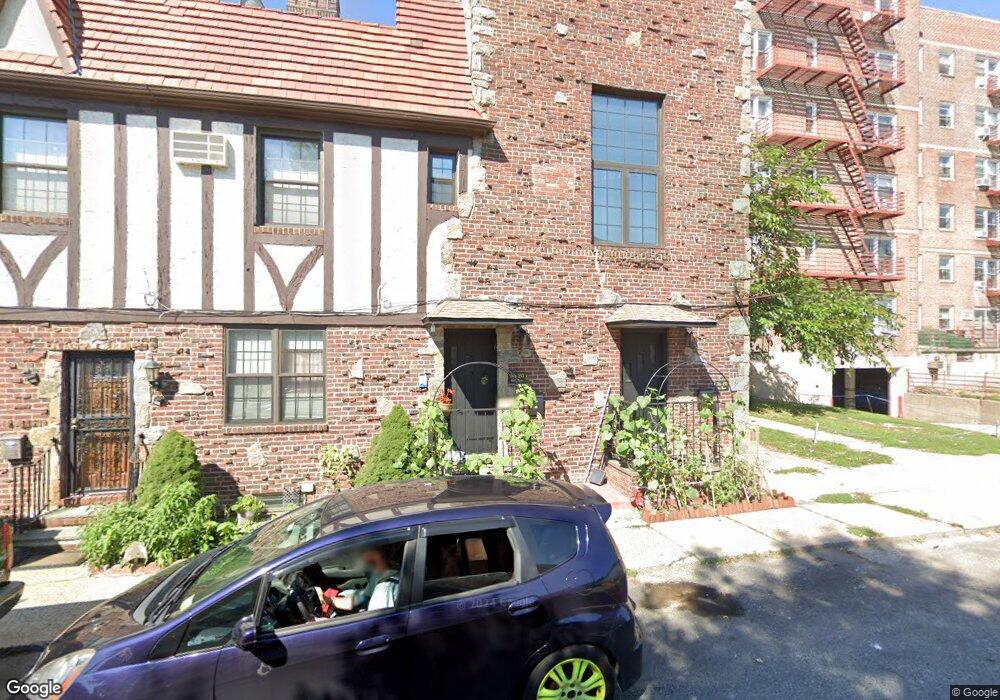
3620 190th St Flushing, NY 11358
Auburndale NeighborhoodEstimated Value: $1,378,000 - $1,484,000
Studio
--
Bath
2,700
Sq Ft
$529/Sq Ft
Est. Value
About This Home
This home is located at 3620 190th St, Flushing, NY 11358 and is currently estimated at $1,428,226, approximately $528 per square foot. 3620 190th St is a home located in Queens County with nearby schools including P.S. 32 - State Street, I.S. 25 Adrien Block, and Francis Lewis High School.
Ownership History
Date
Name
Owned For
Owner Type
Purchase Details
Closed on
Dec 27, 2019
Sold by
Sackos Kyriaki and Vitellas Kyriaki
Bought by
Xu Manli
Current Estimated Value
Home Financials for this Owner
Home Financials are based on the most recent Mortgage that was taken out on this home.
Original Mortgage
$738,000
Outstanding Balance
$649,250
Interest Rate
3.6%
Mortgage Type
New Conventional
Estimated Equity
$778,976
Purchase Details
Closed on
Apr 5, 2002
Sold by
Ggf Properties Llc
Bought by
Vitellas Kyriaki
Home Financials for this Owner
Home Financials are based on the most recent Mortgage that was taken out on this home.
Original Mortgage
$360,000
Interest Rate
5.9%
Mortgage Type
Purchase Money Mortgage
Purchase Details
Closed on
Mar 10, 1999
Sold by
Mantione S Matthew and Mantione Salvatore M
Bought by
Ggf Properties Llc
Purchase Details
Closed on
Nov 10, 1994
Sold by
Guissi Albert J and Guissi Mary
Bought by
Metti Peter A and Metti Anthony F
Create a Home Valuation Report for This Property
The Home Valuation Report is an in-depth analysis detailing your home's value as well as a comparison with similar homes in the area
Home Values in the Area
Average Home Value in this Area
Purchase History
| Date | Buyer | Sale Price | Title Company |
|---|---|---|---|
| Xu Manli | $985,000 | -- | |
| Xu Manli | $985,000 | -- | |
| Vitellas Kyriaki | $450,000 | -- | |
| Vitellas Kyriaki | $450,000 | -- | |
| Ggf Properties Llc | $169,000 | -- | |
| Ggf Properties Llc | $169,000 | -- | |
| Metti Peter A | -- | Commonwealth Land Title Ins | |
| Metti Peter A | -- | Commonwealth Land Title Ins |
Source: Public Records
Mortgage History
| Date | Status | Borrower | Loan Amount |
|---|---|---|---|
| Open | Xu Manli | $738,000 | |
| Closed | Xu Manli | $738,000 | |
| Previous Owner | Vitellas Kyriaki | $360,000 | |
| Closed | Vitellas Kyriaki | $45,000 |
Source: Public Records
Tax History
| Year | Tax Paid | Tax Assessment Tax Assessment Total Assessment is a certain percentage of the fair market value that is determined by local assessors to be the total taxable value of land and additions on the property. | Land | Improvement |
|---|---|---|---|---|
| 2025 | $10,210 | $51,218 | $10,690 | $40,528 |
| 2024 | $10,210 | $50,832 | $11,216 | $39,616 |
| 2023 | $9,632 | $47,955 | $9,136 | $38,819 |
| 2022 | $9,031 | $77,940 | $17,820 | $60,120 |
| 2021 | $8,982 | $75,480 | $17,820 | $57,660 |
| 2020 | $9,035 | $74,040 | $17,820 | $56,220 |
| 2019 | $8,861 | $76,980 | $17,820 | $59,160 |
| 2018 | $8,146 | $39,963 | $12,136 | $27,827 |
| 2017 | $7,685 | $37,701 | $12,372 | $25,329 |
| 2016 | $7,110 | $37,701 | $12,372 | $25,329 |
| 2015 | $4,070 | $35,568 | $14,581 | $20,987 |
| 2014 | $4,070 | $35,301 | $15,031 | $20,270 |
Source: Public Records
Map
Nearby Homes
- 36-20 190th St
- 189-23 39th Ave Unit 122
- 190-05 39th Ave Unit 140
- 190-05 39th Ave Unit 142
- 172-12 Crocheron Ave Unit C3
- 191-9 39th Ave Unit 164
- 191-02 39th Ave
- 36-07 171st St Unit 35
- 191-08 Station Rd
- 19112 Station Rd
- 36-35 171st St Unit 30
- 3639 171st St Unit 26
- 192-14 Station Rd
- 36-20 194th St Unit 3r
- 190-17 42nd Ave
- 3617 194th St
- 34-12 192nd St
- 194-23 Station Rd
- 4038 194th St Unit 3B
- 40-38 194th St Unit A-1
- 3620 190th St
- 36-20 190th St Unit 2+3FL
- 189-37 37th Ave
- 189-37 37th Ave Unit 2
- 18937 37th Ave
- 18937 37th Ave Unit 2
- 18937 37th Ave
- 36-22 190th St
- 36-22 190th St Unit 2 Fl
- 36-22 190th St Unit 1 Fl
- 36-22 190th St Unit 2nd Fl
- 3622 190th St
- 18935 37th Ave Unit 1
- 18935 37th Ave
- 18941 37th Ave
- 189-41 37th Ave
- 18933 37th Ave
- 18933 37th Ave
- 18933 37th Ave Unit Lower
- 18939 37th Ave
Your Personal Tour Guide
Ask me questions while you tour the home.