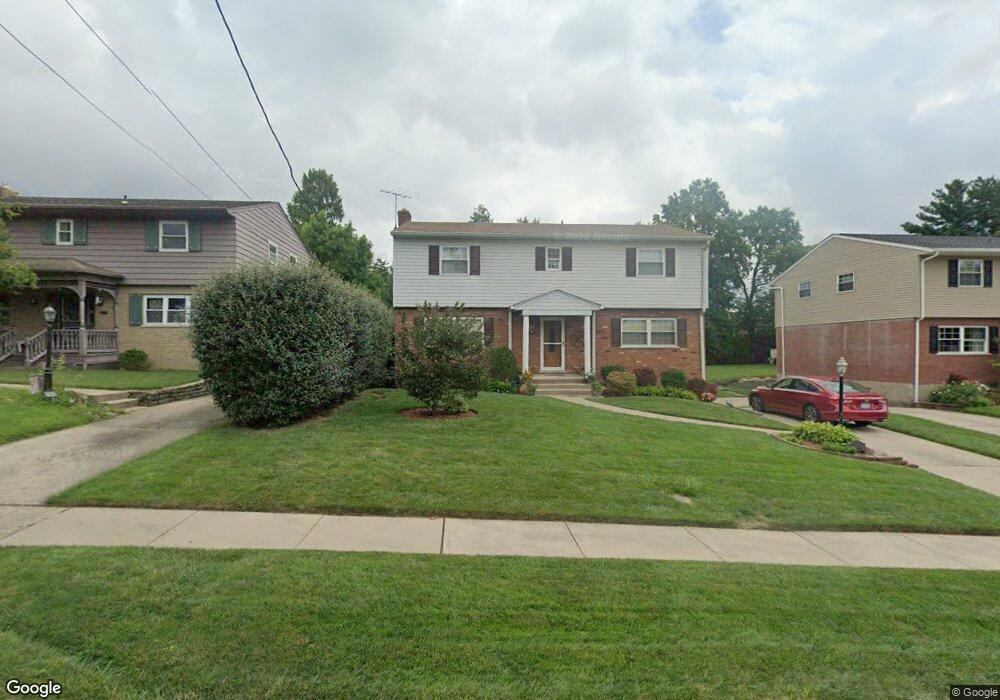
3620 Krierview Dr Cincinnati, OH 45248
Estimated Value: $347,317 - $409,000
4
Beds
3
Baths
2,829
Sq Ft
$138/Sq Ft
Est. Value
About This Home
This home is located at 3620 Krierview Dr, Cincinnati, OH 45248 and is currently estimated at $390,329, approximately $137 per square foot. 3620 Krierview Dr is a home located in Hamilton County with nearby schools including Oakdale Elementary School, Bridgetown Middle School, and Oak Hills High School.
Ownership History
Date
Name
Owned For
Owner Type
Purchase Details
Closed on
Oct 26, 2007
Sold by
Lamping Brian W and Lamping Kelly A
Bought by
Rathbone Jason A and Rathbone Theresa A
Current Estimated Value
Home Financials for this Owner
Home Financials are based on the most recent Mortgage that was taken out on this home.
Original Mortgage
$213,300
Outstanding Balance
$132,482
Interest Rate
6.38%
Mortgage Type
Unknown
Estimated Equity
$257,847
Purchase Details
Closed on
Sep 29, 2000
Sold by
Voelker Adelaide T
Bought by
Lamping Brian W and Lamping Kelly A
Home Financials for this Owner
Home Financials are based on the most recent Mortgage that was taken out on this home.
Original Mortgage
$148,000
Interest Rate
7.99%
Create a Home Valuation Report for This Property
The Home Valuation Report is an in-depth analysis detailing your home's value as well as a comparison with similar homes in the area
Home Values in the Area
Average Home Value in this Area
Purchase History
| Date | Buyer | Sale Price | Title Company |
|---|---|---|---|
| Rathbone Jason A | $219,900 | Advanced Land Title Agency | |
| Lamping Brian W | $190,000 | L & D Title Agency Inc |
Source: Public Records
Mortgage History
| Date | Status | Borrower | Loan Amount |
|---|---|---|---|
| Open | Rathbone Jason A | $213,300 | |
| Previous Owner | Lamping Brian W | $148,000 |
Source: Public Records
Tax History
| Year | Tax Paid | Tax Assessment Tax Assessment Total Assessment is a certain percentage of the fair market value that is determined by local assessors to be the total taxable value of land and additions on the property. | Land | Improvement |
|---|---|---|---|---|
| 2025 | $5,234 | $100,528 | $14,200 | $86,328 |
| 2023 | $5,109 | $100,528 | $14,200 | $86,328 |
| 2022 | $4,192 | $69,895 | $12,684 | $57,211 |
| 2021 | $3,765 | $69,895 | $12,684 | $57,211 |
| 2020 | $3,813 | $69,895 | $12,684 | $57,211 |
| 2019 | $3,732 | $62,409 | $11,326 | $51,083 |
| 2018 | $3,738 | $62,409 | $11,326 | $51,083 |
| 2017 | $3,523 | $62,409 | $11,326 | $51,083 |
| 2016 | $3,560 | $62,993 | $11,634 | $51,359 |
| 2015 | $3,591 | $62,993 | $11,634 | $51,359 |
| 2014 | $3,596 | $62,993 | $11,634 | $51,359 |
| 2013 | $3,394 | $63,630 | $11,753 | $51,877 |
Source: Public Records
Map
Nearby Homes
- 3589 Eyrich Rd
- 3570 Eyrich Rd
- 2 Ebenezer Rd
- 3433 Tolland Ct
- 3454 Eyrich Rd
- 5961 Lawrence Rd
- 5696 Biscayne Ave
- 3311 Starhaven Trail
- 5647 N Glen Rd
- 5630 Eula Ave
- 5638 N Glen Rd
- 6214 Berauer Rd
- 5584 Green Acres Ct
- 5549 Surrey Ave
- 3986 Trailside Dr
- 4008 Trailside Dr
- 3994 Trailside Dr
- 5775 Irwin Dr
- 5517 Surrey Ave
- 3307 Glenmont Ln
- 3626 Krierview Dr
- 3612 Krierview Dr
- 3632 Krierview Dr
- 3606 Krierview Dr
- 3621 Coral Gables Rd
- 3625 Coral Gables Rd
- 3615 Coral Gables Rd
- 3638 Krierview Dr
- 3600 Krierview Dr
- 3635 Coral Gables Rd
- 3611 Coral Gables Rd
- 3623 Krierview Dr
- 3639 Coral Gables Rd
- 3629 Krierview Dr
- 3609 Krierview Dr
- 3644 Krierview Dr
- 3594 Krierview Dr
- 3641 Coral Gables Rd
- 3637 Coral Gables Rd
- 3601 Coral Gables Rd
Your Personal Tour Guide
Ask me questions while you tour the home.