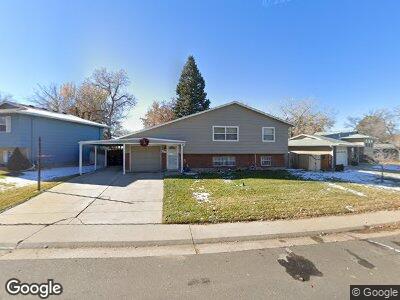
3621 S Marshall Way Denver, CO 80235
Bear Valley NeighborhoodEstimated Value: $521,000 - $642,000
4
Beds
2
Baths
1,052
Sq Ft
$541/Sq Ft
Est. Value
About This Home
This home is located at 3621 S Marshall Way, Denver, CO 80235 and is currently estimated at $569,194, approximately $541 per square foot. 3621 S Marshall Way is a home located in Denver County with nearby schools including Sabin World School, Bear Valley International School, and John F Kennedy High School.
Ownership History
Date
Name
Owned For
Owner Type
Purchase Details
Closed on
Aug 5, 2018
Sold by
Martin Robert A and Martin Florence M
Bought by
Martin Irma G and Martin Jose G
Current Estimated Value
Home Financials for this Owner
Home Financials are based on the most recent Mortgage that was taken out on this home.
Original Mortgage
$70,000
Interest Rate
4.5%
Mortgage Type
Closed End Mortgage
Purchase Details
Closed on
Mar 11, 2010
Sold by
Martin Jose G and Martin Irma G
Bought by
Martin Jose G and Martin Irma G
Home Financials for this Owner
Home Financials are based on the most recent Mortgage that was taken out on this home.
Original Mortgage
$222,832
Interest Rate
4.95%
Mortgage Type
FHA
Purchase Details
Closed on
Jun 5, 2003
Sold by
Martinez Leandro and Martinez Elvira S
Bought by
Martin Jose G and Martin Alfonso
Home Financials for this Owner
Home Financials are based on the most recent Mortgage that was taken out on this home.
Original Mortgage
$213,878
Interest Rate
5.56%
Mortgage Type
FHA
Create a Home Valuation Report for This Property
The Home Valuation Report is an in-depth analysis detailing your home's value as well as a comparison with similar homes in the area
Home Values in the Area
Average Home Value in this Area
Purchase History
| Date | Buyer | Sale Price | Title Company |
|---|---|---|---|
| Martin Irma G | -- | None Available | |
| Martin Jose G | -- | Heritage Title | |
| Martin Jose G | $216,900 | -- |
Source: Public Records
Mortgage History
| Date | Status | Borrower | Loan Amount |
|---|---|---|---|
| Open | Martin Irma G | $30,295 | |
| Open | Martin Jose G | $190,000 | |
| Closed | Martin Irma G | $70,000 | |
| Closed | Martin Irma | $112,000 | |
| Closed | Martin Jose G | $222,832 | |
| Closed | Martin Jose G | $44,500 | |
| Closed | Martin Irma G | $28,600 | |
| Closed | Martin Jose G | $213,878 |
Source: Public Records
Tax History Compared to Growth
Tax History
| Year | Tax Paid | Tax Assessment Tax Assessment Total Assessment is a certain percentage of the fair market value that is determined by local assessors to be the total taxable value of land and additions on the property. | Land | Improvement |
|---|---|---|---|---|
| 2024 | $2,508 | $31,660 | $1,290 | $30,370 |
| 2023 | $2,453 | $31,660 | $1,290 | $30,370 |
| 2022 | $2,126 | $26,730 | $5,160 | $21,570 |
| 2021 | $2,052 | $27,500 | $5,310 | $22,190 |
| 2020 | $1,925 | $25,940 | $5,310 | $20,630 |
| 2019 | $1,871 | $25,940 | $5,310 | $20,630 |
| 2018 | $1,535 | $19,840 | $4,900 | $14,940 |
| 2017 | $1,530 | $19,840 | $4,900 | $14,940 |
| 2016 | $1,550 | $19,010 | $4,919 | $14,091 |
| 2015 | $1,485 | $19,010 | $4,919 | $14,091 |
| 2014 | $1,111 | $13,380 | $3,980 | $9,400 |
Source: Public Records
Map
Nearby Homes
- 3600 S Pierce St Unit 1-207
- 3600 S Pierce St Unit 7-201
- 3600 S Pierce St Unit 1-104
- 3600 S Pierce St Unit 7-104
- 3600 S Pierce St Unit 5-101
- 6156 W Jefferson Ave
- 3633 S Ingalls St
- 3494 S Otis Ct
- 5995 W Hampden Ave Unit 3
- 5995 W Hampden Ave Unit 17
- 5995 W Hampden Ave Unit 8
- 5995 W Hampden Ave Unit 23A
- 5995 W Hampden Ave Unit 13G
- 3550 S Harlan St Unit 177
- 3550 S Harlan St Unit 259
- 3550 S Harlan St Unit 311
- 3550 S Harlan St Unit 174
- 3550 S Harlan St Unit 313
- 6000 W Floyd Ave Unit 116
- 6000 W Floyd Ave Unit 307
- 3621 S Marshall Way
- 3651 S Marshall Way
- 3601 S Marshall Way
- 3608 S Newland St
- 3671 S Marshall Way
- 3630 S Marshall Way
- 3628 S Newland St
- 3640 S Marshall Way
- 3620 S Marshall Way
- 3650 S Marshall Way
- 3610 S Marshall Way
- 3660 S Marshall Way
- 3600 S Marshall Way
- 3675 S Marshall Way
- 3638 S Newland St
- 3609 S Newland St
- 3599 S Newland St
- 3670 S Marshall Way
- 3589 S Newland St
- 3619 S Newland St