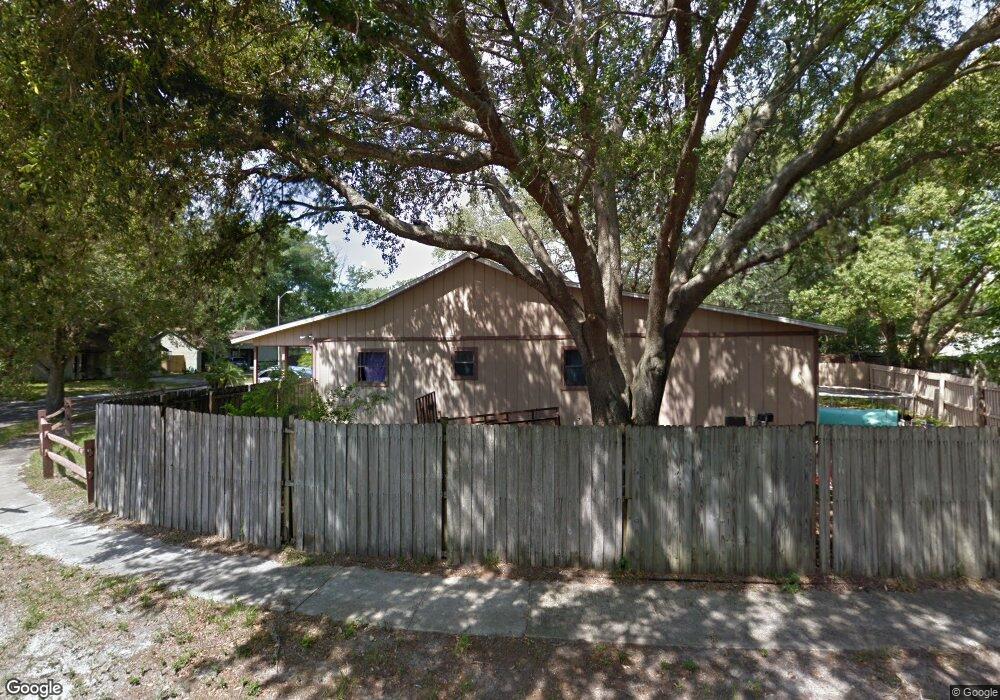
3621 Shady Grove Cir Orlando, FL 32810
Lockhart NeighborhoodEstimated Value: $342,000 - $417,000
4
Beds
2
Baths
2,496
Sq Ft
$151/Sq Ft
Est. Value
About This Home
This home is located at 3621 Shady Grove Cir, Orlando, FL 32810 and is currently estimated at $377,285, approximately $151 per square foot. 3621 Shady Grove Cir is a home located in Orange County with nearby schools including Riverside Elementary School, Lockhart Middle School, and Wekiva High School.
Ownership History
Date
Name
Owned For
Owner Type
Purchase Details
Closed on
May 30, 2011
Sold by
Jpmorgan Chase National Association
Bought by
Davidson Kenneth A
Current Estimated Value
Home Financials for this Owner
Home Financials are based on the most recent Mortgage that was taken out on this home.
Original Mortgage
$65,069
Interest Rate
4.57%
Mortgage Type
New Conventional
Purchase Details
Closed on
Jul 27, 2010
Sold by
Rojas Jorge H
Bought by
Jpmorgan Chase Bank National Association
Purchase Details
Closed on
Mar 21, 2005
Sold by
Ladd Kathryn M and Ladd George A
Bought by
Rojas Jorge H and Gonzalez Miriam
Home Financials for this Owner
Home Financials are based on the most recent Mortgage that was taken out on this home.
Original Mortgage
$133,520
Interest Rate
5.95%
Mortgage Type
Unknown
Create a Home Valuation Report for This Property
The Home Valuation Report is an in-depth analysis detailing your home's value as well as a comparison with similar homes in the area
Home Values in the Area
Average Home Value in this Area
Purchase History
| Date | Buyer | Sale Price | Title Company |
|---|---|---|---|
| Davidson Kenneth A | $72,299 | Dolphin Title Of Brandon | |
| Jpmorgan Chase Bank National Association | -- | None Available | |
| Rojas Jorge H | $166,900 | Fidelity National Title Ins |
Source: Public Records
Mortgage History
| Date | Status | Borrower | Loan Amount |
|---|---|---|---|
| Previous Owner | Davidson Kenneth A | $65,069 | |
| Previous Owner | Rojas Jorge H | $133,520 | |
| Closed | Rojas Jorge H | $33,380 |
Source: Public Records
Tax History Compared to Growth
Tax History
| Year | Tax Paid | Tax Assessment Tax Assessment Total Assessment is a certain percentage of the fair market value that is determined by local assessors to be the total taxable value of land and additions on the property. | Land | Improvement |
|---|---|---|---|---|
| 2025 | $5,177 | $266,264 | -- | -- |
| 2024 | $4,648 | $266,264 | -- | -- |
| 2023 | $4,648 | $349,671 | $50,000 | $299,671 |
| 2022 | $4,141 | $302,278 | $50,000 | $252,278 |
| 2021 | $3,645 | $241,617 | $40,000 | $201,617 |
| 2020 | $3,269 | $224,897 | $40,000 | $184,897 |
| 2019 | $3,096 | $194,372 | $40,000 | $154,372 |
| 2018 | $2,803 | $166,805 | $29,500 | $137,305 |
| 2017 | $2,504 | $139,981 | $25,000 | $114,981 |
| 2016 | $2,352 | $129,890 | $22,000 | $107,890 |
| 2015 | $2,215 | $118,143 | $19,000 | $99,143 |
| 2014 | $2,001 | $95,556 | $19,000 | $76,556 |
Source: Public Records
Map
Nearby Homes
- 3711 Shady Grove Cir
- 3606 Needles Dr
- 3809 Needles Dr
- 8216 Hilton Way
- 3423 Calumet Dr
- 2207 Calloway Dr
- 3902 Castell Dr
- 3033 Sutton Dr
- 3024 Sutton Dr
- 3201 Joyann St
- 7736 Compass Dr
- 2530 Domenico Paul Way
- 4221 Greenfern Dr
- 7641 Compass Dr
- 8116 Forest City Rd
- 4190 Rossmore Dr
- 913 Lotus Vista Dr Unit 101
- 2718 Maitland Crossing Way Unit 202
- 7918 Torro Ct
- 844 Grand Regency Pointe Unit 203
- 3610 Shady Grove Cir
- 3627 Shady Grove Cir
- 3612 Peaceful Place
- 8509 Sunlit Ln
- 3618 Peaceful Place
- 8503 Sunlit Ln
- 3622 Shady Grove Cir
- 3616 Shady Grove Cir
- 8515 Sunlit Ln
- 3604 Shady Grove Cir
- 3628 Shady Grove Cir
- 8521 Sunlit Ln
- 3624 Peaceful Place
- 3639 Shady Grove Cir
- 3634 Shady Grove Cir
- 8527 Sunlit Ln
- 3630 Peaceful Place
- 3705 Shady Grove Cir
- 3640 Shady Grove Cir
- 3611 Peaceful Place