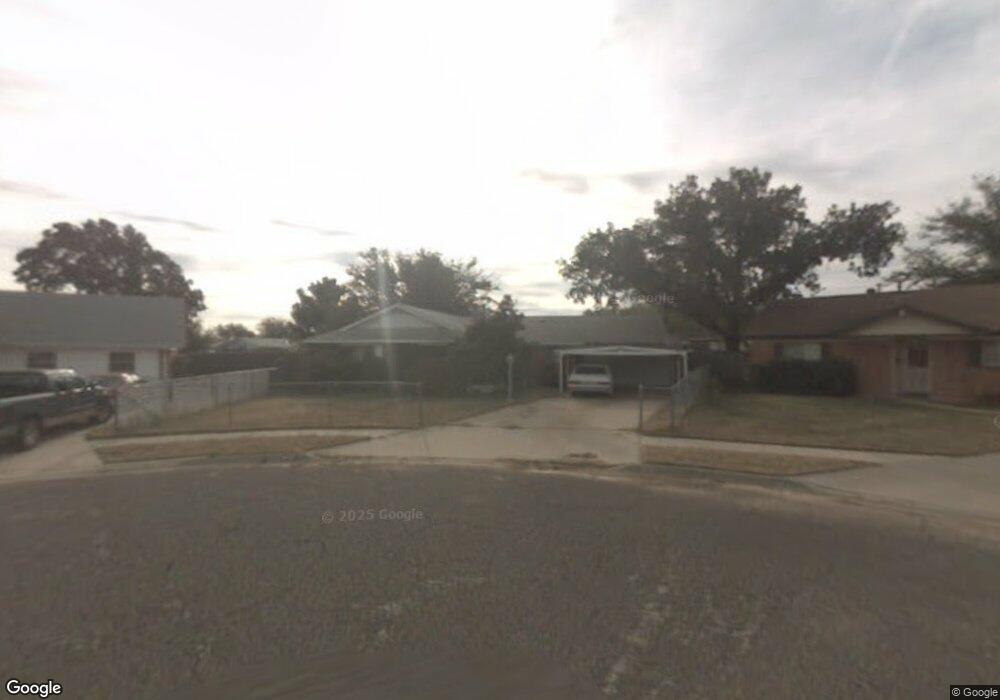
3621 Sinclair Ave Midland, TX 79707
Wedgewood Park NeighborhoodEstimated Value: $275,914 - $316,000
--
Bed
--
Bath
1,755
Sq Ft
$167/Sq Ft
Est. Value
About This Home
This home is located at 3621 Sinclair Ave, Midland, TX 79707 and is currently estimated at $292,729, approximately $166 per square foot. 3621 Sinclair Ave is a home located in Midland County with nearby schools including Rusk Elementary School, Alamo Junior High School, and Midland Montessori School.
Ownership History
Date
Name
Owned For
Owner Type
Purchase Details
Closed on
Jun 28, 2012
Sold by
Minor Nicole
Bought by
Minor Braxton
Current Estimated Value
Purchase Details
Closed on
Jan 19, 2012
Sold by
Nabors Lee T
Bought by
Minor Braxton and Minor Nicole
Home Financials for this Owner
Home Financials are based on the most recent Mortgage that was taken out on this home.
Original Mortgage
$172,962
Interest Rate
4.03%
Mortgage Type
FHA
Purchase Details
Closed on
Jul 15, 2011
Sold by
Pine James D and Pine Norma
Bought by
Nabors Lee T
Home Financials for this Owner
Home Financials are based on the most recent Mortgage that was taken out on this home.
Original Mortgage
$132,000
Interest Rate
4.52%
Mortgage Type
New Conventional
Purchase Details
Closed on
Mar 4, 2011
Sold by
Pinkerton Donna G Overby and Overby Hulsey Pamala J
Bought by
Pine James D and Pine Norma
Purchase Details
Closed on
Jul 15, 1974
Bought by
Minor Braxton
Create a Home Valuation Report for This Property
The Home Valuation Report is an in-depth analysis detailing your home's value as well as a comparison with similar homes in the area
Home Values in the Area
Average Home Value in this Area
Purchase History
| Date | Buyer | Sale Price | Title Company |
|---|---|---|---|
| Minor Braxton | -- | None Available | |
| Minor Braxton | -- | West Texas Abstract | |
| Nabors Lee T | -- | None Available | |
| Pine James D | -- | West Texas Abstract & Title | |
| Minor Braxton | -- | -- |
Source: Public Records
Mortgage History
| Date | Status | Borrower | Loan Amount |
|---|---|---|---|
| Previous Owner | Minor Braxton | $172,962 | |
| Previous Owner | Nabors Lee T | $132,000 |
Source: Public Records
Tax History Compared to Growth
Tax History
| Year | Tax Paid | Tax Assessment Tax Assessment Total Assessment is a certain percentage of the fair market value that is determined by local assessors to be the total taxable value of land and additions on the property. | Land | Improvement |
|---|---|---|---|---|
| 2025 | $2,680 | $226,320 | $21,780 | $204,540 |
| 2024 | $2,685 | $249,620 | $21,780 | $227,840 |
| 2023 | $2,636 | $249,620 | $21,780 | $227,840 |
| 2022 | $3,951 | $252,850 | $21,780 | $231,070 |
| 2021 | $4,405 | $252,850 | $21,780 | $231,070 |
| 2020 | $3,605 | $241,390 | $21,780 | $219,610 |
| 2019 | $4,406 | $232,720 | $21,780 | $219,610 |
| 2018 | $4,113 | $211,560 | $21,780 | $189,780 |
| 2017 | $3,891 | $200,140 | $21,780 | $178,360 |
| 2016 | $3,902 | $200,340 | $21,780 | $178,560 |
| 2015 | -- | $200,340 | $21,780 | $178,560 |
| 2014 | -- | $191,960 | $21,780 | $170,180 |
Source: Public Records
Map
Nearby Homes
- 2000 Freeport Ln
- 3523 Lonoke Ave
- 1509 Cascade Ct
- 1502 Alcove Ct
- 1818 Northern Ln
- 1824 Northern Ln
- 3517 Seaboard Ave
- 4313 W Dengar Ave
- 0000 N Midland Dr
- 1103 Tarleton St
- 2106 Rosita Dr
- 3802 Suncrest Ave
- 2906 Aurora Ln
- 2121 Bonham St
- 3204 Shell Ave
- 4342 W Dengar Ave
- 3311 Terrace Ave
- 3214 Lockheed Dr
- 3213 Shell Ave
- 3213 Sentinel Dr
- 3619 Sinclair Ave
- 3623 Sinclair Ave
- 3618 Boyd Ave
- 3617 Sinclair Ave
- 3620 Boyd Ave
- 3616 Boyd Ave
- 3625 Sinclair Ave
- 3622 Boyd Ave
- 3614 Boyd Ave
- 3627 Sinclair Ave
- 3615 Sinclair Ave
- 1804 McDonald St
- 3612 Boyd Ave
- 1802 McDonald St
- 1806 Mc Donald St
- 1806 McDonald St
- 1804 Mc Donald St
- 1802 Mc Donald St
- 3618 Sinclair Ave
- 3616 Sinclair Ave