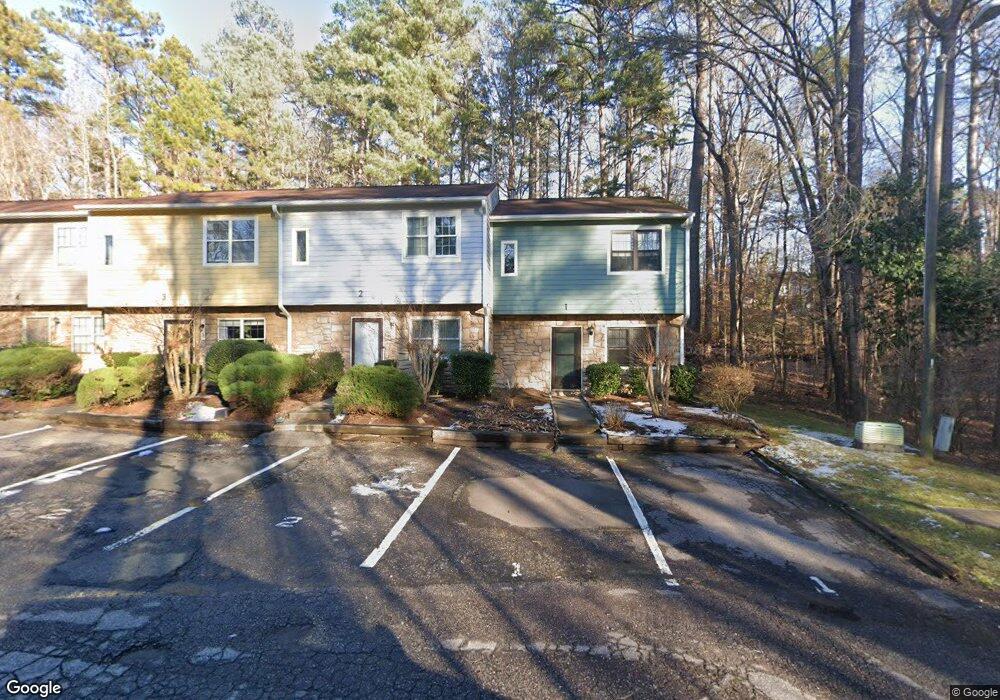
3622 Colchester St Unit 1 Durham, NC 27707
Hope Valley NeighborhoodEstimated Value: $212,000 - $241,000
2
Beds
2
Baths
1,014
Sq Ft
$220/Sq Ft
Est. Value
About This Home
This home is located at 3622 Colchester St Unit 1, Durham, NC 27707 and is currently estimated at $223,293, approximately $220 per square foot. 3622 Colchester St Unit 1 is a home located in Durham County with nearby schools including Morehead Montessori, Sherwood Githens Middle, and Jordan High School.
Ownership History
Date
Name
Owned For
Owner Type
Purchase Details
Closed on
Jun 13, 2024
Sold by
Hutchinson Blythe L
Bought by
Hutchinson Blythe L
Current Estimated Value
Home Financials for this Owner
Home Financials are based on the most recent Mortgage that was taken out on this home.
Original Mortgage
$223,100
Outstanding Balance
$220,360
Interest Rate
7.22%
Mortgage Type
New Conventional
Estimated Equity
$2,933
Purchase Details
Closed on
May 8, 2019
Sold by
Schultz Corey R
Bought by
Redder Sandra Lou
Home Financials for this Owner
Home Financials are based on the most recent Mortgage that was taken out on this home.
Original Mortgage
$135,333
Interest Rate
4%
Mortgage Type
New Conventional
Purchase Details
Closed on
Jan 21, 2015
Sold by
Conrad Karan N and Conrad Robert M
Bought by
Schultz Corey R
Home Financials for this Owner
Home Financials are based on the most recent Mortgage that was taken out on this home.
Original Mortgage
$62,840
Interest Rate
3.75%
Mortgage Type
FHA
Create a Home Valuation Report for This Property
The Home Valuation Report is an in-depth analysis detailing your home's value as well as a comparison with similar homes in the area
Home Values in the Area
Average Home Value in this Area
Purchase History
| Date | Buyer | Sale Price | Title Company |
|---|---|---|---|
| Hutchinson Blythe L | $230,000 | None Listed On Document | |
| Redder Sandra Lou | $150,500 | Equity Resource Of Ohio Inc | |
| Schultz Corey R | $64,000 | None Available |
Source: Public Records
Mortgage History
| Date | Status | Borrower | Loan Amount |
|---|---|---|---|
| Open | Hutchinson Blythe L | $223,100 | |
| Previous Owner | Redder Sandra Lou | $135,333 | |
| Previous Owner | Schultz Corey R | $62,840 |
Source: Public Records
Tax History Compared to Growth
Tax History
| Year | Tax Paid | Tax Assessment Tax Assessment Total Assessment is a certain percentage of the fair market value that is determined by local assessors to be the total taxable value of land and additions on the property. | Land | Improvement |
|---|---|---|---|---|
| 2025 | $935 | $239,746 | $80,000 | $159,746 |
| 2024 | $935 | $67,024 | $12,000 | $55,024 |
| 2023 | $878 | $67,024 | $12,000 | $55,024 |
| 2022 | $858 | $67,024 | $12,000 | $55,024 |
| 2021 | $854 | $67,024 | $12,000 | $55,024 |
| 2020 | $834 | $67,024 | $12,000 | $55,024 |
| 2019 | $834 | $67,024 | $12,000 | $55,024 |
| 2018 | $878 | $64,753 | $10,000 | $54,753 |
| 2017 | $872 | $64,753 | $10,000 | $54,753 |
| 2016 | $843 | $64,753 | $10,000 | $54,753 |
| 2015 | $1,071 | $77,375 | $14,200 | $63,175 |
| 2014 | $1,071 | $77,375 | $14,200 | $63,175 |
Source: Public Records
Map
Nearby Homes
- 3622 Colchester St Unit 7
- 10 Winchester Ct
- 11 Winchester Ct
- 1 Westbury Place
- 1100 Stonehedge Ave
- 3613 A Suffolk St
- 3613 B Suffolk St
- 11 Silverbush Ct
- 3315 Denada Path
- 1311 Martin Luther King Junior Pkwy
- 1310 Martin Luther King Pkwy
- 3535 Hope Valley Rd
- 3333 Lassiter St
- 45 Birnham Ln
- 3306 Swansea St
- 3600 Trail 23
- 3623 Hope Valley Rd
- 3629 Hope Valley Rd
- 19 Pennington Place
- 3300 Mossdale Ave
- 3622 Colchester St Unit 13
- 3622 Colchester St Unit 22
- 3622 Colchester St Unit 10
- 3622 Colchester St Unit 23
- 3622 Colchester St Unit 18
- 3622 Colchester St Unit 28
- 3622 Colchester St Unit 20
- 3622 Colchester St
- 3622 Colchester St
- 3622 Colchester St
- 3622 Colchester St
- 3622 Colchester St
- 3622 Colchester St
- 3622 Colchester St
- 3622 Colchester St
- 3622 Colchester St
- 3622 Colchester St
- 3622 Colchester St
- 3622 Colchester St
- 3622 Colchester St