3622 S 64th Ln Phoenix, AZ 85043
Estrella Village NeighborhoodEstimated Value: $330,075 - $396,000
3
Beds
3
Baths
1,828
Sq Ft
$201/Sq Ft
Est. Value
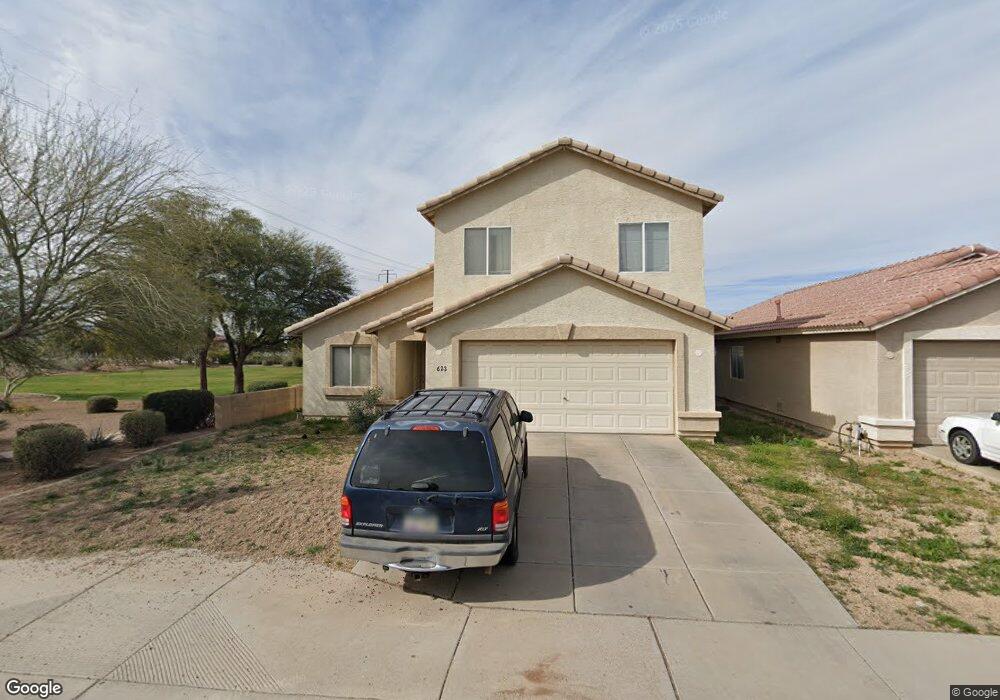
About This Home
This home is located at 3622 S 64th Ln, Phoenix, AZ 85043 and is currently estimated at $367,269, approximately $200 per square foot. 3622 S 64th Ln is a home located in Maricopa County with nearby schools including Kings Ridge Preparatory Academy, Betty Fairfax High School, and Phoenix Coding Academy.
Ownership History
Date
Name
Owned For
Owner Type
Purchase Details
Closed on
Jan 6, 2005
Sold by
Auernheimer David and Auernheimer Sharon
Bought by
Chabra Rakesh and Chabra Poornima
Current Estimated Value
Home Financials for this Owner
Home Financials are based on the most recent Mortgage that was taken out on this home.
Original Mortgage
$100,000
Outstanding Balance
$50,321
Interest Rate
5.7%
Mortgage Type
New Conventional
Estimated Equity
$316,948
Purchase Details
Closed on
May 16, 2002
Sold by
Sivage Thomas Homes Of Arizona Inc
Bought by
Auernheimer David and Auernheimer Sharon
Home Financials for this Owner
Home Financials are based on the most recent Mortgage that was taken out on this home.
Original Mortgage
$136,488
Interest Rate
7.13%
Mortgage Type
FHA
Purchase Details
Closed on
May 31, 2001
Sold by
Estrella Manor Investment Group Llc
Bought by
Sivage Thomas Of Arizona Inc
Create a Home Valuation Report for This Property
The Home Valuation Report is an in-depth analysis detailing your home's value as well as a comparison with similar homes in the area
Home Values in the Area
Average Home Value in this Area
Purchase History
| Date | Buyer | Sale Price | Title Company |
|---|---|---|---|
| Chabra Rakesh | $166,000 | Fidelity National Title | |
| Auernheimer David | $138,416 | First American Title Ins Co | |
| Sivage Thomas Homes Of Arizona Inc | -- | First American Title Ins Co | |
| Sivage Thomas Of Arizona Inc | $441,000 | Fidelity National Title |
Source: Public Records
Mortgage History
| Date | Status | Borrower | Loan Amount |
|---|---|---|---|
| Open | Chabra Rakesh | $100,000 | |
| Previous Owner | Auernheimer David | $136,488 |
Source: Public Records
Tax History
| Year | Tax Paid | Tax Assessment Tax Assessment Total Assessment is a certain percentage of the fair market value that is determined by local assessors to be the total taxable value of land and additions on the property. | Land | Improvement |
|---|---|---|---|---|
| 2025 | $1,355 | $11,100 | -- | -- |
| 2024 | $1,282 | $10,572 | -- | -- |
| 2023 | $1,282 | $27,020 | $5,400 | $21,620 |
| 2022 | $1,264 | $19,750 | $3,950 | $15,800 |
| 2021 | $1,261 | $18,210 | $3,640 | $14,570 |
| 2020 | $1,239 | $15,970 | $3,190 | $12,780 |
| 2019 | $1,215 | $14,500 | $2,900 | $11,600 |
| 2018 | $1,198 | $13,030 | $2,600 | $10,430 |
| 2017 | $1,126 | $11,950 | $2,390 | $9,560 |
| 2016 | $1,075 | $10,460 | $2,090 | $8,370 |
| 2015 | $983 | $9,480 | $1,890 | $7,590 |
Source: Public Records
Map
Nearby Homes
- 3829 S 64th Dr
- 6311 W Williams St
- 6403 W Winslow Ave
- 6209 W Jones Ave
- 6205 W Encinas Ln Unit 1
- 7201 W Broadway Rd Unit 1042
- 6058 W Pueblo Ave Unit II
- 4015 S 59th Ln Unit IV
- 7105 W Globe Ave
- 4114 S 58th Ln
- 7139 W Pioneer St
- 4110 S 58th Ln
- 4130 S 58th Ln
- 7121 W Williams St
- 4236 S 58th Ln
- 5740 W Raymond St
- 6537 W Gross Ave
- 5733 W Odeum Ln
- 6413 W Chickasaw St
- 5722 W Atlantis Ave
- 3618 S 64th Ln
- 3614 S 64th Ln
- 3610 S 64th Ln
- 6441 W Riva Rd
- 3617 S 65th Dr
- 6442 W Riva Rd
- 6437 W Riva Rd
- 3606 S 64th Ln
- 3613 S 65th Dr
- 6438 W Riva Rd
- 3609 S 65th Dr
- 6433 W Riva Rd
- 3602 S 64th Ln
- 6429 W Elwood St
- 6505 W Riva Rd
- 6429 W Riva Rd
- 6425 W Elwood St
- 6430 W Riva Rd
- 3601 S 65th Dr
- 6510 W Riva Rd
Your Personal Tour Guide
Ask me questions while you tour the home.