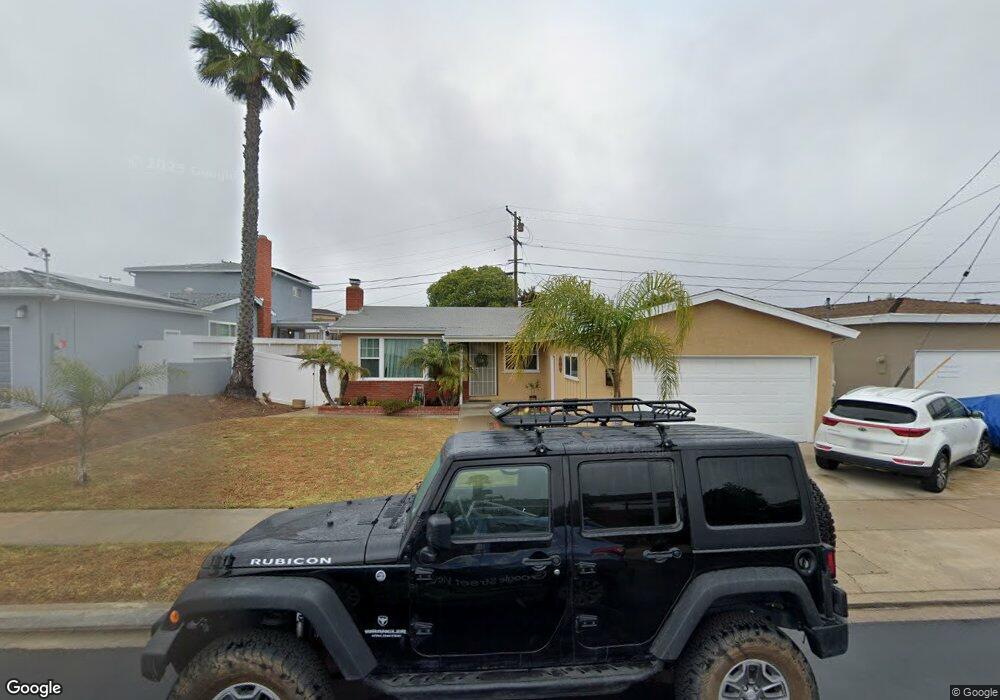
3623 Belford St San Diego, CA 92111
Clairemont Mesa East NeighborhoodEstimated Value: $982,707 - $1,069,000
3
Beds
2
Baths
1,232
Sq Ft
$828/Sq Ft
Est. Value
About This Home
This home is located at 3623 Belford St, San Diego, CA 92111 and is currently estimated at $1,020,427, approximately $828 per square foot. 3623 Belford St is a home located in San Diego County with nearby schools including Ross Elementary, Montgomery Middle School, and Kavod Charter School.
Ownership History
Date
Name
Owned For
Owner Type
Purchase Details
Closed on
Feb 11, 2013
Sold by
Baker Jeffrey A and Baker Michelle F
Bought by
Fenalti Gustavo and Roth Daniela Martino
Current Estimated Value
Home Financials for this Owner
Home Financials are based on the most recent Mortgage that was taken out on this home.
Original Mortgage
$324,000
Interest Rate
3.47%
Mortgage Type
New Conventional
Purchase Details
Closed on
Oct 12, 2005
Sold by
Wallace Bruce J and Wallace Kathy D
Bought by
Baker Jeffrey A and Baker Michelle F
Purchase Details
Closed on
Oct 14, 1998
Sold by
Floto Douglas W and Floto Marie G
Bought by
Wallace Bruce J and Wallace Kathy D
Home Financials for this Owner
Home Financials are based on the most recent Mortgage that was taken out on this home.
Original Mortgage
$201,960
Interest Rate
6.61%
Mortgage Type
VA
Purchase Details
Closed on
Oct 30, 1992
Purchase Details
Closed on
Jul 13, 1988
Create a Home Valuation Report for This Property
The Home Valuation Report is an in-depth analysis detailing your home's value as well as a comparison with similar homes in the area
Home Values in the Area
Average Home Value in this Area
Purchase History
| Date | Buyer | Sale Price | Title Company |
|---|---|---|---|
| Fenalti Gustavo | $405,000 | Corinthian Title Company | |
| Baker Jeffrey A | $497,500 | New Century Title Company | |
| Wallace Bruce J | $198,000 | Chicago Title Co | |
| -- | $175,500 | -- | |
| -- | $154,900 | -- |
Source: Public Records
Mortgage History
| Date | Status | Borrower | Loan Amount |
|---|---|---|---|
| Previous Owner | Fenalti Gustavo | $324,000 | |
| Previous Owner | Wallace Bruce J | $201,960 |
Source: Public Records
Tax History Compared to Growth
Tax History
| Year | Tax Paid | Tax Assessment Tax Assessment Total Assessment is a certain percentage of the fair market value that is determined by local assessors to be the total taxable value of land and additions on the property. | Land | Improvement |
|---|---|---|---|---|
| 2025 | $6,040 | $498,717 | $390,889 | $107,828 |
| 2024 | $6,040 | $488,939 | $383,225 | $105,714 |
| 2023 | $5,906 | $479,353 | $375,711 | $103,642 |
| 2022 | $5,749 | $469,955 | $368,345 | $101,610 |
| 2021 | $5,710 | $460,741 | $361,123 | $99,618 |
| 2020 | $5,641 | $456,018 | $357,421 | $98,597 |
| 2019 | $5,541 | $447,077 | $350,413 | $96,664 |
| 2018 | $5,181 | $438,312 | $343,543 | $94,769 |
| 2017 | $80 | $429,718 | $336,807 | $92,911 |
| 2016 | $4,977 | $421,293 | $330,203 | $91,090 |
| 2015 | $4,904 | $414,966 | $325,244 | $89,722 |
| 2014 | $4,827 | $406,838 | $318,873 | $87,965 |
Source: Public Records
Map
Nearby Homes
- 7131 Malta St
- 3516 Atoll St
- 3484 Armstrong St
- 7265 Arillo St
- 7273 Arillo St
- 7029 Hilton Place
- 7441 Beagle St
- 3662 Marlesta Dr
- 7045 Beagle St
- 3654 Marlesta Dr
- 3781 Ashford St
- 3373 Armstrong St
- 3758 Antiem St
- 7414 Ashford Place
- 7003 E Batista St
- 3735 Budd St
- 6617 Rockglen Ave
- 8036 Linda Vista Rd Unit 2
- 8036 Linda Vista Rd Unit 1F
- 8036 Linda Vista Rd Unit 2P