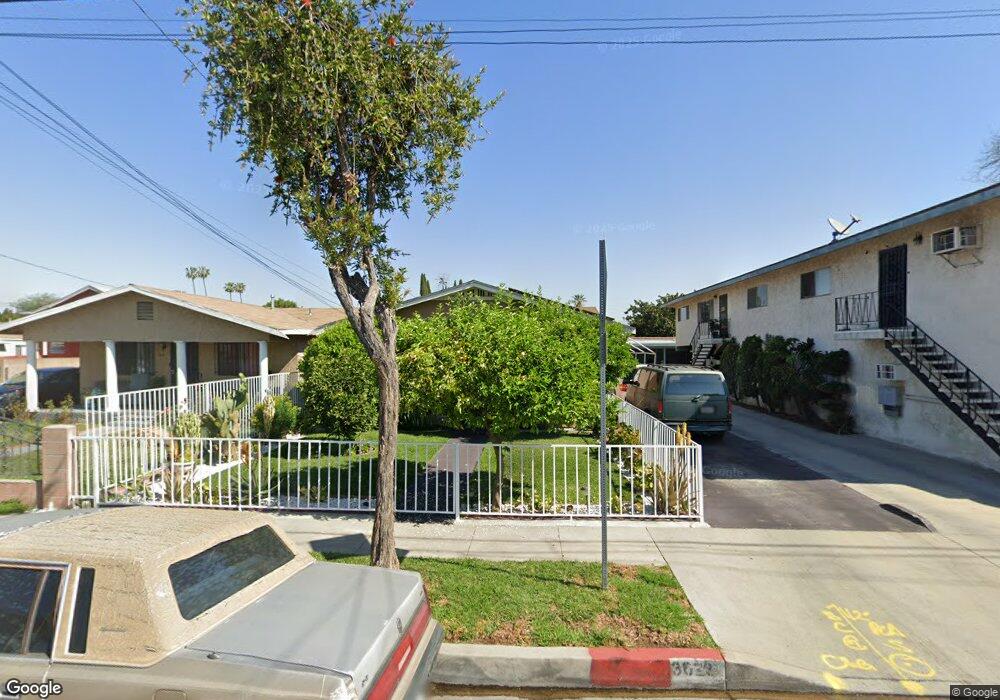
3623 E 60th Place Huntington Park, CA 90255
Estimated Value: $598,420 - $666,000
3
Beds
1
Bath
1,050
Sq Ft
$612/Sq Ft
Est. Value
About This Home
This home is located at 3623 E 60th Place, Huntington Park, CA 90255 and is currently estimated at $642,105, approximately $611 per square foot. 3623 E 60th Place is a home located in Los Angeles County with nearby schools including Huntington Park Elementary School, Chester W. Nimitz Middle School, and Maywood Academy High School.
Ownership History
Date
Name
Owned For
Owner Type
Purchase Details
Closed on
Feb 28, 2001
Sold by
Hernandez Jesus
Bought by
Hernandez Jesus and Hernandez Enriqueta
Current Estimated Value
Purchase Details
Closed on
Apr 29, 1998
Sold by
Hernandez Enriqueta
Bought by
Hernandez Jesus
Home Financials for this Owner
Home Financials are based on the most recent Mortgage that was taken out on this home.
Original Mortgage
$119,323
Interest Rate
7.07%
Mortgage Type
FHA
Purchase Details
Closed on
Mar 26, 1998
Sold by
Ocwen Federal Bank Fsb
Bought by
Hernandez Jesus and Barajas Socorro
Home Financials for this Owner
Home Financials are based on the most recent Mortgage that was taken out on this home.
Original Mortgage
$119,323
Interest Rate
7.07%
Mortgage Type
FHA
Purchase Details
Closed on
Jul 10, 1997
Sold by
Lacayo Humberto M
Bought by
Ocwen Federal Bank Fsb
Purchase Details
Closed on
Mar 7, 1997
Sold by
Lacayo Humberto M
Bought by
Lacayo Yolanda and Lacayo Humberto
Create a Home Valuation Report for This Property
The Home Valuation Report is an in-depth analysis detailing your home's value as well as a comparison with similar homes in the area
Home Values in the Area
Average Home Value in this Area
Purchase History
| Date | Buyer | Sale Price | Title Company |
|---|---|---|---|
| Hernandez Jesus | -- | -- | |
| Hernandez Jesus | -- | Fidelity National Title Co | |
| Hernandez Jesus | $120,000 | Fidelity National Title Co | |
| Ocwen Federal Bank Fsb | $100,870 | Chicago Title Co | |
| Lacayo Yolanda | -- | -- |
Source: Public Records
Mortgage History
| Date | Status | Borrower | Loan Amount |
|---|---|---|---|
| Previous Owner | Hernandez Jesus | $119,323 |
Source: Public Records
Tax History Compared to Growth
Tax History
| Year | Tax Paid | Tax Assessment Tax Assessment Total Assessment is a certain percentage of the fair market value that is determined by local assessors to be the total taxable value of land and additions on the property. | Land | Improvement |
|---|---|---|---|---|
| 2025 | $5,577 | $223,525 | $134,167 | $89,358 |
| 2024 | $5,577 | $219,143 | $131,537 | $87,606 |
| 2023 | $5,512 | $214,847 | $128,958 | $85,889 |
| 2022 | $5,361 | $210,635 | $126,430 | $84,205 |
| 2021 | $5,311 | $206,505 | $123,951 | $82,554 |
| 2019 | $5,201 | $200,382 | $120,276 | $80,106 |
| 2018 | $5,068 | $196,454 | $117,918 | $78,536 |
| 2016 | $2,962 | $188,828 | $113,340 | $75,488 |
| 2015 | $2,912 | $185,993 | $111,638 | $74,355 |
| 2014 | $2,902 | $182,351 | $109,452 | $72,899 |
Source: Public Records
Map
Nearby Homes
- 3519 E 60th St
- 6133 Orchard Ave
- 3800 E 57th St
- 6059 Riverside Ave
- 3633 Gage Ave
- 5421 Everett Ave
- 5503 Maywood Ave
- 4212 E 58th St
- 4301 E 60th St
- 3738 E 53rd St
- 4026 Gage Ave
- 3267 E Gage Ave
- 5712 Fishburn Ave
- 3510 Nevada St
- 3755 E 52nd St
- 4339 E 58th St
- 4001 E 52nd St
- 4 beds/2.5 baths Plan at Amada Homes
- 3 bed/ 3 baths Plan at Amada Homes
- 4 beds/ 3 baths Plan at Amada Homes
- 3629 E 60th Place Unit A
- 3619 E 60th Place
- 3633 E 60th Place
- 3615 E 60th Place
- 3637 E 60th Place
- 3611 E 60th Place
- 3634 E 60th St
- 3630 E 60th St
- 3640 E 60th St
- 3609 E 60th Place
- 3628 E 60th St
- 3644 E 60th St
- 3639 E 60th Place
- 3624 E 60th St
- 3648 E 60th St
- 3624 E 60th Place
- 3620 E 60th Place
- 3628 E 60th Place
- 3605 E 60th Place
- 3616 E 60th Place