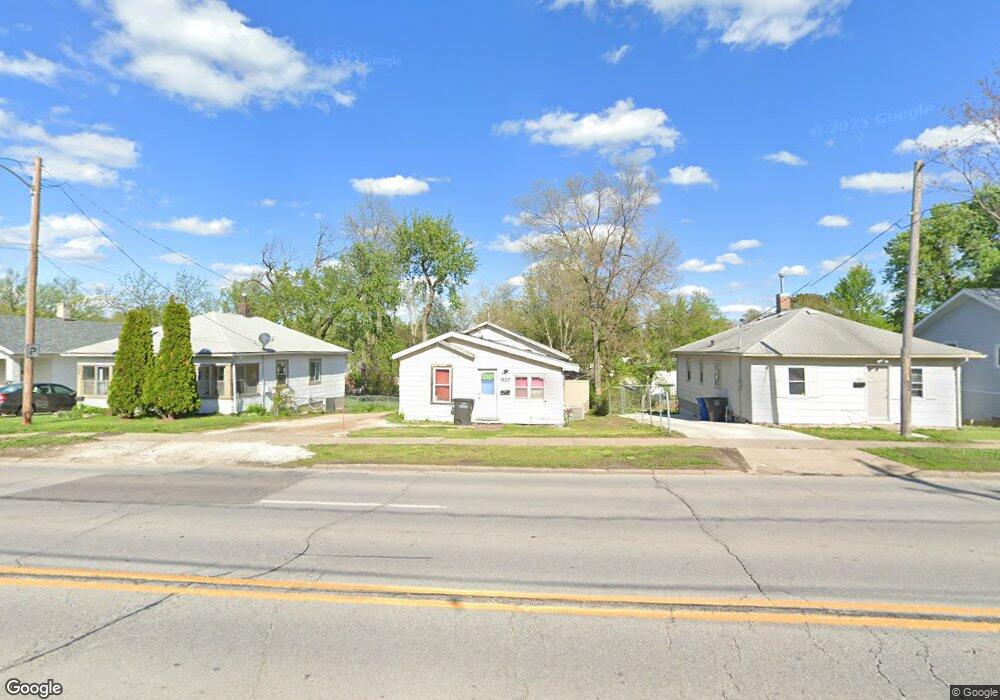
3623 SW 9th St Des Moines, IA 50315
Watrous Heights NeighborhoodEstimated Value: $68,000 - $145,000
2
Beds
1
Bath
756
Sq Ft
$136/Sq Ft
Est. Value
About This Home
This home is located at 3623 SW 9th St, Des Moines, IA 50315 and is currently estimated at $102,883, approximately $136 per square foot. 3623 SW 9th St is a home located in Polk County with nearby schools including Park Avenue Elementary School, Brody Middle School, and Lincoln High School.
Ownership History
Date
Name
Owned For
Owner Type
Purchase Details
Closed on
Jun 6, 2025
Sold by
Blue Edge Investments Llc
Bought by
Pibble Properties Llc
Current Estimated Value
Home Financials for this Owner
Home Financials are based on the most recent Mortgage that was taken out on this home.
Original Mortgage
$116,088
Outstanding Balance
$115,790
Interest Rate
6.81%
Mortgage Type
New Conventional
Estimated Equity
-$12,907
Purchase Details
Closed on
May 7, 2025
Sold by
Waters Samuel Larry Bee and Waters Judy Kay
Bought by
Blue Edge Investments Llc
Home Financials for this Owner
Home Financials are based on the most recent Mortgage that was taken out on this home.
Original Mortgage
$116,088
Outstanding Balance
$115,790
Interest Rate
6.81%
Mortgage Type
New Conventional
Estimated Equity
-$12,907
Purchase Details
Closed on
Jul 5, 2017
Sold by
Jr Gerald D Marchant
Bought by
Waters Samuel Larry Bee and Waters Judy Key
Purchase Details
Closed on
Aug 19, 2015
Sold by
Marchant Larry and Marchant Janeen
Bought by
Marchant Gerald D
Purchase Details
Closed on
Sep 3, 2013
Sold by
Marchant Gerald D
Bought by
Marchant Larry and Marchant Joneen
Purchase Details
Closed on
May 27, 2008
Sold by
Marchant Jack A and Marchant Gerald D
Bought by
Marchant Gerald Dean and Marchant Phyllis Opal
Purchase Details
Closed on
Oct 13, 2000
Sold by
Marchant Gerald Dean
Bought by
Marchant Gerald Dean and Marchant Phyllis
Home Financials for this Owner
Home Financials are based on the most recent Mortgage that was taken out on this home.
Original Mortgage
$29,615
Interest Rate
7%
Mortgage Type
Land Contract Argmt. Of Sale
Create a Home Valuation Report for This Property
The Home Valuation Report is an in-depth analysis detailing your home's value as well as a comparison with similar homes in the area
Home Values in the Area
Average Home Value in this Area
Purchase History
| Date | Buyer | Sale Price | Title Company |
|---|---|---|---|
| Pibble Properties Llc | $69,000 | None Listed On Document | |
| Pibble Properties Llc | $69,000 | None Listed On Document | |
| Blue Edge Investments Llc | $37,000 | None Listed On Document | |
| Blue Edge Investments Llc | $37,000 | None Listed On Document | |
| Waters Samuel Larry Bee | $30,000 | None Available | |
| Marchant Gerald D | -- | Attorney | |
| Marchant Larry | $34,500 | None Available | |
| Marchant Gerald Dean | $29,500 | None Available | |
| Marchant Gerald Dean | $30,000 | -- |
Source: Public Records
Mortgage History
| Date | Status | Borrower | Loan Amount |
|---|---|---|---|
| Open | Pibble Properties Llc | $116,088 | |
| Closed | Pibble Properties Llc | $116,088 | |
| Previous Owner | Marchant Gerald Dean | $29,615 | |
| Closed | Marchant Larry | $0 |
Source: Public Records
Tax History Compared to Growth
Tax History
| Year | Tax Paid | Tax Assessment Tax Assessment Total Assessment is a certain percentage of the fair market value that is determined by local assessors to be the total taxable value of land and additions on the property. | Land | Improvement |
|---|---|---|---|---|
| 2025 | $798 | $75,600 | $27,800 | $47,800 |
| 2024 | $798 | $66,700 | $24,500 | $42,200 |
| 2023 | $986 | $66,700 | $24,500 | $42,200 |
| 2022 | $976 | $54,100 | $20,100 | $34,000 |
| 2021 | $896 | $54,100 | $20,100 | $34,000 |
| 2020 | $1,240 | $47,800 | $17,900 | $29,900 |
| 2019 | $1,132 | $47,800 | $17,900 | $29,900 |
| 2018 | $1,120 | $42,100 | $15,600 | $26,500 |
| 2017 | $1,030 | $42,100 | $15,600 | $26,500 |
| 2016 | $1,041 | $38,100 | $14,100 | $24,000 |
| 2015 | $774 | $38,100 | $14,100 | $24,000 |
| 2014 | $770 | $37,700 | $13,800 | $23,900 |
Source: Public Records
Map
Nearby Homes
- 3605 SW 9th St
- 3618 SW 9th St
- 915 Wolcott Ave
- 3903 SW 9th St
- 3308 SW 7th St
- 410 Thornton Ave
- 3634 SW 4th St
- 3514 SW 12th St
- 606 Marion St
- 3824 SW 12th St
- 3808 SW 12th St
- 4204 SW 7th St
- 300 Hughes Ave
- 3503 SW 2nd St
- 1222 Watrous Ave
- 4020 SW 12th St
- 3724 SW 13th St
- 4108 SW 12th St
- 3224 SW 2nd St
- 1230 Park Ave
- 3619 SW 9th St
- 3627 SW 9th St
- 3615 SW 9th St
- 3701 SW 9th St
- 3609 SW 9th St
- 3624 SW 8th St
- 3620 SW 8th St
- 0 Outlot X Community at Arbor Lake Plat 1
- 3700 SW 8th St
- 3612 SW 8th St
- 3704 SW 8th St
- 3620 SW 9th St
- 800 Thornton Ave
- 3712 SW 8th St
- 3612 SW 9th St
- 3608 SW 9th St
- 3716 SW 8th St
- 905 Wolcott Ave
- 3600 SW 9th St
- 3619 SW 8th St