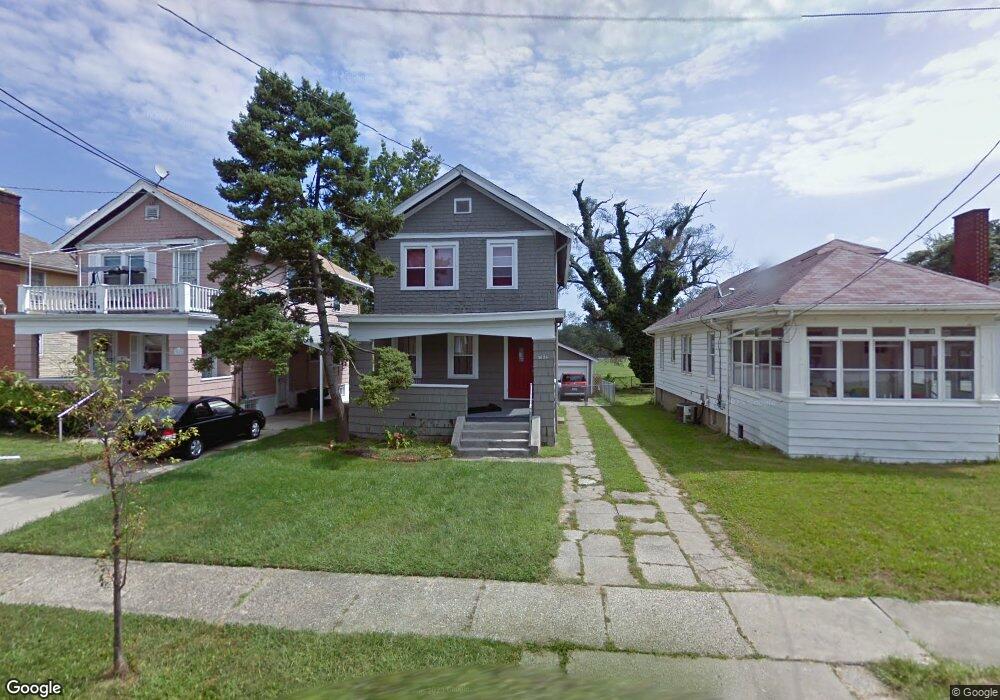
3624 Tamarack Ave Cincinnati, OH 45207
Hyde Park NeighborhoodEstimated Value: $254,000 - $360,835
3
Beds
2
Baths
1,520
Sq Ft
$194/Sq Ft
Est. Value
About This Home
This home is located at 3624 Tamarack Ave, Cincinnati, OH 45207 and is currently estimated at $294,959, approximately $194 per square foot. 3624 Tamarack Ave is a home located in Hamilton County with nearby schools including Withrow University High School, Clark Montessori High School, and Shroder High School.
Ownership History
Date
Name
Owned For
Owner Type
Purchase Details
Closed on
Mar 12, 2007
Sold by
Stamps Randy D and Stamps Lara Koch
Bought by
Vinson Elton
Current Estimated Value
Home Financials for this Owner
Home Financials are based on the most recent Mortgage that was taken out on this home.
Original Mortgage
$120,000
Outstanding Balance
$71,737
Interest Rate
6.4%
Mortgage Type
Unknown
Estimated Equity
$223,222
Purchase Details
Closed on
Dec 12, 2005
Sold by
Rickard James B
Bought by
Stamps Randy D and Stamps Lara Koch
Home Financials for this Owner
Home Financials are based on the most recent Mortgage that was taken out on this home.
Original Mortgage
$72,000
Interest Rate
10.62%
Mortgage Type
Fannie Mae Freddie Mac
Create a Home Valuation Report for This Property
The Home Valuation Report is an in-depth analysis detailing your home's value as well as a comparison with similar homes in the area
Home Values in the Area
Average Home Value in this Area
Purchase History
| Date | Buyer | Sale Price | Title Company |
|---|---|---|---|
| Vinson Elton | $150,000 | Advanced Land Title Agency | |
| Stamps Randy D | $80,000 | None Available |
Source: Public Records
Mortgage History
| Date | Status | Borrower | Loan Amount |
|---|---|---|---|
| Open | Vinson Elton | $120,000 | |
| Previous Owner | Stamps Randy D | $72,000 |
Source: Public Records
Tax History
| Year | Tax Paid | Tax Assessment Tax Assessment Total Assessment is a certain percentage of the fair market value that is determined by local assessors to be the total taxable value of land and additions on the property. | Land | Improvement |
|---|---|---|---|---|
| 2025 | $5,307 | $86,027 | $34,986 | $51,041 |
| 2023 | $5,264 | $86,027 | $34,986 | $51,041 |
| 2022 | $3,776 | $55,293 | $20,132 | $35,161 |
| 2021 | $3,638 | $55,293 | $20,132 | $35,161 |
| 2020 | $3,738 | $55,293 | $20,132 | $35,161 |
| 2019 | $3,526 | $47,667 | $17,357 | $30,310 |
| 2018 | $3,531 | $47,667 | $17,357 | $30,310 |
| 2017 | $3,358 | $47,667 | $17,357 | $30,310 |
| 2016 | $3,194 | $51,433 | $17,658 | $33,775 |
| 2015 | $2,880 | $51,433 | $17,658 | $33,775 |
| 2014 | $2,900 | $51,433 | $17,658 | $33,775 |
| 2013 | $2,391 | $41,948 | $15,092 | $26,856 |
Source: Public Records
Map
Nearby Homes
- 3600 Tamarack Ave
- 3635 Barberry Ave
- 2497 Downing Dr
- 3766 Floral Ave
- 2242 Ivy Ave
- 2312 Dana Ave
- 2352 Dana Ave Unit 2352
- 2446 Duck Creek Rd
- 3764 Grovedale Place
- 3819 Hazel Ave
- 3914 S Madison Ave
- 2217 Crane Ave
- 3923 S Madison Ave
- 3666 Burch Ave
- 3931 Burwood Ave
- 3640 Besuden Ct
- 2380 Madison Rd
- 3929 Hazel Ave
- 2374 Madison Rd
- 3629 Evanston Ave
- 3620 Tamarack Ave
- 3626 Tamarack Ave
- 3616 Tamarack Ave
- 3632 Tamarack Ave
- 3614 Tamarack Ave
- 3636 Tamarack Ave
- 3638 Tamarack Ave
- 3610 Tamarack Ave
- 3619 Tamarack Ave
- 3621 Tamarack Ave
- 3615 Tamarack Ave
- 3625 Tamarack Ave Unit 2
- 3625 Tamarack Ave
- 3609 Tamarack Ave
- 3644 Tamarack Ave
- 3627 Tamarack Ave
- 3604 Tamarack Ave
- 3605 Tamarack Ave
- 3631 Tamarack Ave
- 3648 Tamarack Ave
Your Personal Tour Guide
Ask me questions while you tour the home.