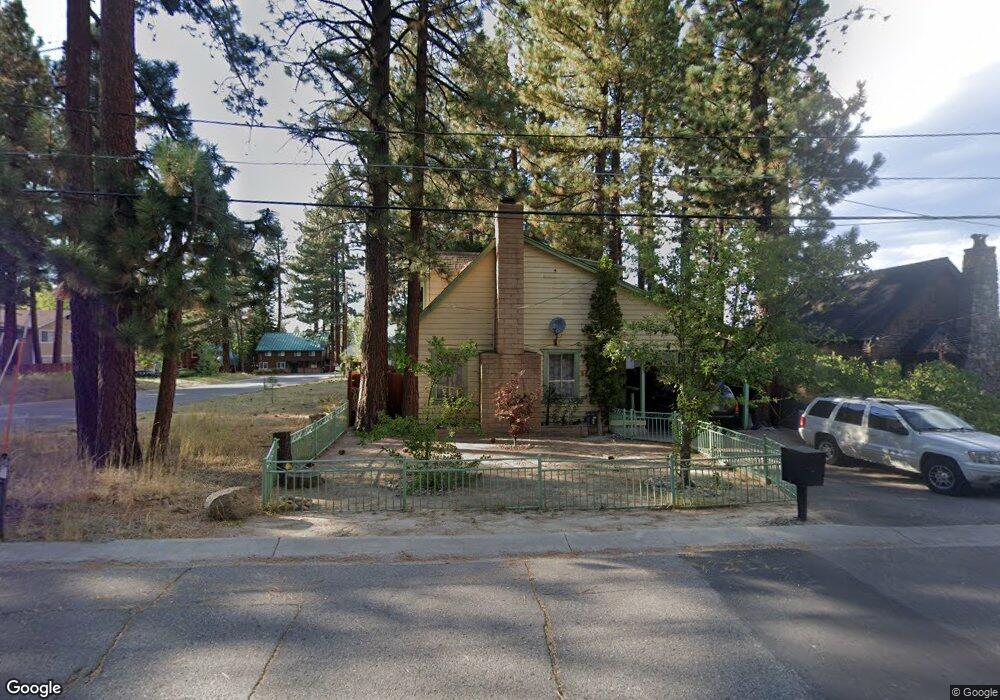
3625 Paradise Ave South Lake Tahoe, CA 96150
Estimated Value: $543,000 - $634,000
3
Beds
2
Baths
1,330
Sq Ft
$431/Sq Ft
Est. Value
About This Home
This home is located at 3625 Paradise Ave, South Lake Tahoe, CA 96150 and is currently estimated at $572,931, approximately $430 per square foot. 3625 Paradise Ave is a home located in El Dorado County with nearby schools including Bijou Community, South Tahoe Middle School, and South Tahoe High School.
Ownership History
Date
Name
Owned For
Owner Type
Purchase Details
Closed on
Jan 19, 2007
Sold by
Arciga Jose Luis Herrera and Jose Luis Herrera A
Bought by
Arciga Jose Luis Herrera
Current Estimated Value
Home Financials for this Owner
Home Financials are based on the most recent Mortgage that was taken out on this home.
Original Mortgage
$155,000
Outstanding Balance
$92,059
Interest Rate
6.1%
Mortgage Type
New Conventional
Estimated Equity
$480,872
Purchase Details
Closed on
Aug 13, 2004
Sold by
Rojas Jorge C
Bought by
Herrera A Jose Luis
Purchase Details
Closed on
Aug 6, 1998
Sold by
Rojas Elena
Bought by
Rojas Jorge C
Home Financials for this Owner
Home Financials are based on the most recent Mortgage that was taken out on this home.
Original Mortgage
$106,391
Interest Rate
6.88%
Mortgage Type
FHA
Purchase Details
Closed on
Jan 17, 1996
Sold by
Huey Lily
Bought by
Huey Lily and Revocable Living Trust Of Lily
Create a Home Valuation Report for This Property
The Home Valuation Report is an in-depth analysis detailing your home's value as well as a comparison with similar homes in the area
Home Values in the Area
Average Home Value in this Area
Purchase History
| Date | Buyer | Sale Price | Title Company |
|---|---|---|---|
| Arciga Jose Luis Herrera | -- | First American Title Ins Co | |
| Herrera A Jose Luis | -- | -- | |
| Rojas Jorge C | -- | Old Republic Title Company | |
| Herrera-A Jose Luis | $109,000 | Old Republic Title Company | |
| Huey Lily | -- | -- |
Source: Public Records
Mortgage History
| Date | Status | Borrower | Loan Amount |
|---|---|---|---|
| Open | Arciga Jose Luis Herrera | $155,000 | |
| Previous Owner | Herrera-A Jose Luis | $106,391 |
Source: Public Records
Tax History Compared to Growth
Tax History
| Year | Tax Paid | Tax Assessment Tax Assessment Total Assessment is a certain percentage of the fair market value that is determined by local assessors to be the total taxable value of land and additions on the property. | Land | Improvement |
|---|---|---|---|---|
| 2025 | $3,160 | $295,055 | $75,339 | $219,716 |
| 2024 | $3,160 | $289,270 | $73,862 | $215,408 |
| 2023 | $3,106 | $283,599 | $72,414 | $211,185 |
| 2022 | $3,075 | $278,040 | $70,995 | $207,045 |
| 2021 | $3,028 | $272,589 | $69,603 | $202,986 |
| 2020 | $2,985 | $269,795 | $68,890 | $200,905 |
| 2019 | $2,970 | $264,506 | $67,540 | $196,966 |
| 2018 | $3,509 | $259,320 | $66,216 | $193,104 |
| 2017 | $3,419 | $254,236 | $64,918 | $189,318 |
| 2016 | $2,802 | $249,252 | $63,646 | $185,606 |
| 2015 | $2,772 | $245,510 | $62,691 | $182,819 |
| 2014 | $2,661 | $240,703 | $61,464 | $179,239 |
Source: Public Records
Map
Nearby Homes
- 3535 Lake Tahoe Blvd Unit 130
- 3535 Lake Tahoe Blvd Unit 231
- 3535 Lake Tahoe Blvd Unit 623
- 3535 Lake Tahoe Blvd Unit 520
- 3535 Lake Tahoe Blvd Unit 506
- 3535 Lake Tahoe Blvd Unit 499
- 3535 Lake Tahoe Blvd Unit 329
- 3535 Lake Tahoe Blvd Unit 313
- 3535 Lake Tahoe Blvd Unit 131
- 3608 Aspen Ave
- 3508 Fawn Way
- 1160 Bowers Ave
- 3754 Forest Ave
- 920 Balbijou Rd Unit 229
- 3696 Birch Ave
- 3520 Cloverdale Ave
- 1152 Sonora Ave
- 3680 Tamarack Ave
- 1115 Glenwood Way
- 1181 Ski Run Blvd
- 3627 Paradise Ave
- 3624 Osgood Ave
- 3628 Osgood Ave
- 3628 Paradise Ave
- 3613 Paradise Ave Unit A-B
- 3613 Paradise Ave Unit A
- 3624 Paradise Ave
- 3630 Paradise Ave
- 3609 Paradise Ave Unit A
- 3609 Paradise Ave
- 3608 Osgood Ave
- 3612 Paradise Ave
- 3636 Paradise Ave
- 3605 Paradise Ave
- 3621 Osgood Ave
- 3629 Osgood Ave
- 3629 Forest Ave
- 3615 Osgood Ave
- 3604 Osgood Ave
- 3633 Forest Ave