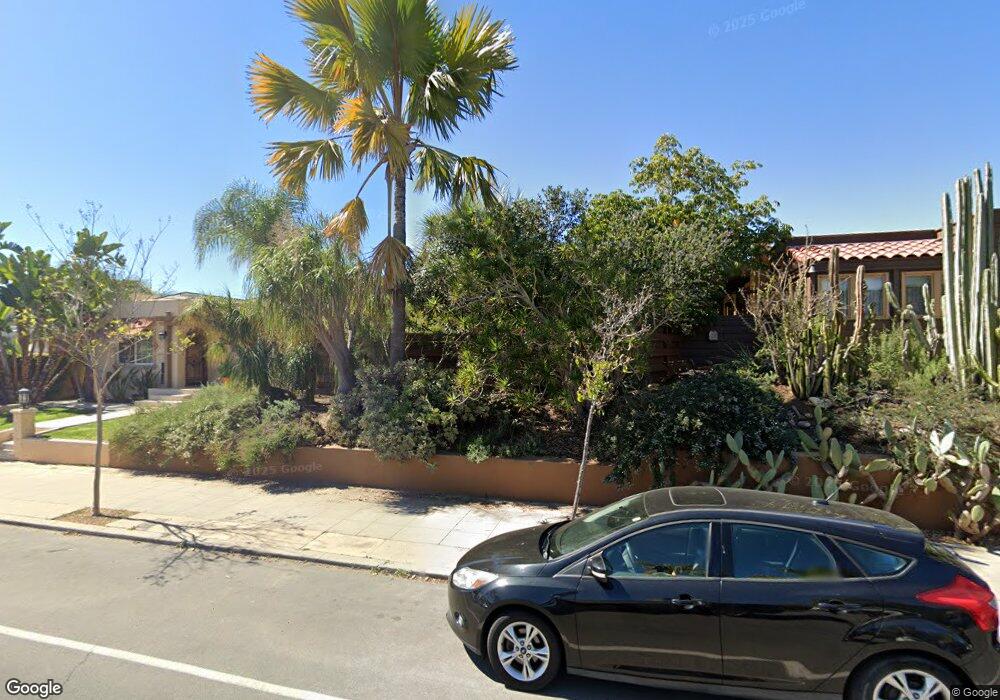
3626 Arnold Ave San Diego, CA 92104
North Park NeighborhoodEstimated Value: $1,765,358 - $2,504,000
3
Beds
3
Baths
3,232
Sq Ft
$653/Sq Ft
Est. Value
About This Home
This home is located at 3626 Arnold Ave, San Diego, CA 92104 and is currently estimated at $2,110,340, approximately $652 per square foot. 3626 Arnold Ave is a home located in San Diego County with nearby schools including Jefferson Elementary, Roosevelt International Middle School, and Kindred Montessori.
Ownership History
Date
Name
Owned For
Owner Type
Purchase Details
Closed on
Feb 16, 2012
Sold by
Grant Tandora Del
Bought by
Grant Tandora D and The Tandora D Grant 2012 Living Trust
Current Estimated Value
Purchase Details
Closed on
Feb 6, 2003
Sold by
Grant Keith Andrew and Delgrant Tandora
Bought by
Grant Keith Andrew and Delgrant Tandora
Home Financials for this Owner
Home Financials are based on the most recent Mortgage that was taken out on this home.
Original Mortgage
$215,300
Outstanding Balance
$92,073
Interest Rate
5.93%
Estimated Equity
$2,018,267
Purchase Details
Closed on
Jun 23, 1998
Sold by
Harris Joseph A Trust 12-02-93 and Joseph A
Bought by
Grant Keith Andrew and Delgrant Tandora
Home Financials for this Owner
Home Financials are based on the most recent Mortgage that was taken out on this home.
Original Mortgage
$227,000
Interest Rate
6.93%
Purchase Details
Closed on
Dec 2, 1993
Sold by
Harris Joseph A
Bought by
Harris Joseph A
Create a Home Valuation Report for This Property
The Home Valuation Report is an in-depth analysis detailing your home's value as well as a comparison with similar homes in the area
Home Values in the Area
Average Home Value in this Area
Purchase History
| Date | Buyer | Sale Price | Title Company |
|---|---|---|---|
| Grant Tandora D | -- | None Available | |
| Grant Keith Andrew | -- | Southland Title Corporation | |
| Grant Keith Andrew | $352,500 | Chicago Title Co | |
| Harris Joseph A | -- | -- |
Source: Public Records
Mortgage History
| Date | Status | Borrower | Loan Amount |
|---|---|---|---|
| Open | Grant Keith Andrew | $215,300 | |
| Closed | Grant Keith Andrew | $227,000 |
Source: Public Records
Tax History Compared to Growth
Tax History
| Year | Tax Paid | Tax Assessment Tax Assessment Total Assessment is a certain percentage of the fair market value that is determined by local assessors to be the total taxable value of land and additions on the property. | Land | Improvement |
|---|---|---|---|---|
| 2025 | $4,416 | $368,388 | $117,565 | $250,823 |
| 2024 | $4,416 | $361,165 | $115,260 | $245,905 |
| 2023 | $4,316 | $354,084 | $113,000 | $241,084 |
| 2022 | $4,199 | $347,142 | $110,785 | $236,357 |
| 2021 | $4,167 | $340,336 | $108,613 | $231,723 |
| 2020 | $4,116 | $336,847 | $107,500 | $229,347 |
| 2019 | $4,041 | $330,243 | $105,393 | $224,850 |
| 2018 | $3,778 | $323,769 | $103,327 | $220,442 |
| 2017 | $3,687 | $317,421 | $101,301 | $216,120 |
| 2016 | $3,625 | $311,198 | $99,315 | $211,883 |
| 2015 | $3,571 | $306,525 | $97,824 | $208,701 |
| 2014 | $3,514 | $300,521 | $95,908 | $204,613 |
Source: Public Records
Map
Nearby Homes
- 3693 Villa Terrace
- 2618 Landis St
- 3537 Louisiana St
- 3533 Louisiana St
- 3660 28th St
- 3764 Villa Terrace
- 3536 Louisiana St
- 3776 Villa Terrace
- 3736-38 Louisiana St
- 3660 Mississippi St
- 3805 Louisiana St
- 3933-45 Hamilton St
- 3776 Alabama St Unit 116
- 3776 Alabama St Unit 117
- 3796 Alabama St Unit 118
- 3796 Alabama St Unit 304
- 2828 University Ave Unit 503
- 3405 Florida St Unit 410
- 3958 Louisiana St Unit 6
- 3946 Utah St Unit 3
- 3626 Arnold Ave
- 3634 Arnold Ave
- 3614 Arnold Ave
- 3640 Arnold Ave
- 3646 Arnold Ave Unit 48
- 2536 Dwight St
- 3604 Arnold Ave
- 2528 Dwight St
- 3625 Arizona St
- 2520 Dwight St
- 3633/3635 Arizona St
- 3637 Arizona St
- 3633 Arizona St Unit 35
- 3625 1/2 Arizona St
- 3652 Arnold Ave Unit 54
- 3617 Arizona St Unit 19
- 3645 Arizona St
- 3615 Arizona St
- 3629 Arnold Ave
- 2510 Dwight St