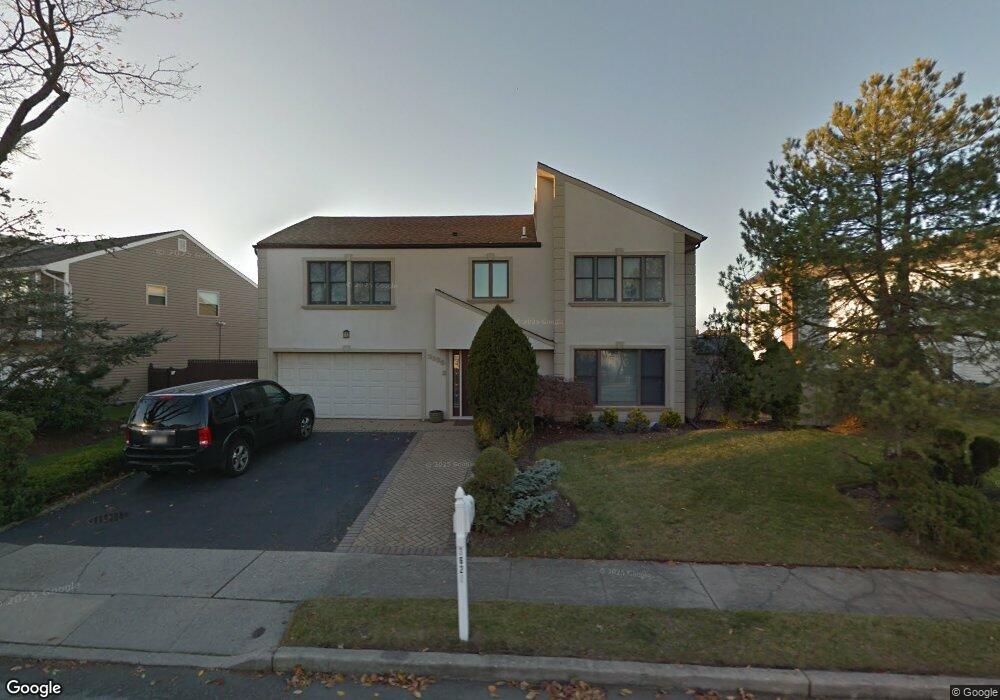
3626 Lorrie Dr Oceanside, NY 11572
Estimated Value: $1,253,974 - $1,314,000
4
Beds
3
Baths
2,940
Sq Ft
$437/Sq Ft
Est. Value
About This Home
This home is located at 3626 Lorrie Dr, Oceanside, NY 11572 and is currently estimated at $1,283,987, approximately $436 per square foot. 3626 Lorrie Dr is a home located in Nassau County with nearby schools including Boardman Elementary School, Oceanside Middle School, and Oceanside High School.
Ownership History
Date
Name
Owned For
Owner Type
Purchase Details
Closed on
Aug 28, 2017
Sold by
Eisner Ndrew D and Kaplan Amy
Bought by
Skurnik Gary T and Skurnik Sandra
Current Estimated Value
Home Financials for this Owner
Home Financials are based on the most recent Mortgage that was taken out on this home.
Original Mortgage
$515,000
Outstanding Balance
$430,292
Interest Rate
3.92%
Mortgage Type
New Conventional
Estimated Equity
$853,695
Purchase Details
Closed on
Jun 28, 2000
Sold by
Goltzer Alan and Goltzer Ellen
Bought by
Eisner Andrew
Purchase Details
Closed on
Oct 19, 1995
Sold by
Vertuccio Vincent and Vertuccio Diana
Bought by
Goltzer Alan and Goltzer Ellen
Home Financials for this Owner
Home Financials are based on the most recent Mortgage that was taken out on this home.
Original Mortgage
$120,000
Interest Rate
7.58%
Create a Home Valuation Report for This Property
The Home Valuation Report is an in-depth analysis detailing your home's value as well as a comparison with similar homes in the area
Home Values in the Area
Average Home Value in this Area
Purchase History
| Date | Buyer | Sale Price | Title Company |
|---|---|---|---|
| Skurnik Gary T | $715,000 | None Available | |
| Eisner Andrew | $515,000 | Robert Seward | |
| Goltzer Alan | $375,000 | -- |
Source: Public Records
Mortgage History
| Date | Status | Borrower | Loan Amount |
|---|---|---|---|
| Open | Skurnik Gary T | $515,000 | |
| Previous Owner | Goltzer Alan | $120,000 |
Source: Public Records
Tax History Compared to Growth
Tax History
| Year | Tax Paid | Tax Assessment Tax Assessment Total Assessment is a certain percentage of the fair market value that is determined by local assessors to be the total taxable value of land and additions on the property. | Land | Improvement |
|---|---|---|---|---|
| 2025 | $20,517 | $753 | $258 | $495 |
| 2024 | $5,437 | $711 | $235 | $476 |
| 2023 | $18,269 | $766 | $253 | $513 |
| 2022 | $18,269 | $781 | $258 | $523 |
| 2021 | $24,446 | $806 | $267 | $539 |
| 2020 | $18,839 | $1,001 | $633 | $368 |
| 2019 | $6,042 | $1,205 | $762 | $443 |
| 2018 | $12,088 | $1,205 | $0 | $0 |
| 2017 | $10,542 | $1,205 | $762 | $443 |
| 2016 | $16,056 | $1,205 | $676 | $529 |
| 2015 | $5,937 | $1,358 | $762 | $596 |
| 2014 | $5,937 | $1,358 | $762 | $596 |
| 2013 | $5,519 | $1,358 | $762 | $596 |
Source: Public Records
Map
Nearby Homes
- 243 Mott St
- 237 Mott St
- 3461 Ocean Ave
- 341 Green Ct
- 3452 Ocean Ave
- 189 Philips Place
- 3665 Carrel Blvd
- 3666 Illona Ln
- 3515 Oceanside Rd
- 163 Mott St
- 3391 Fairway Rd
- 487 Links Dr E
- 24 Strangford Ct
- 313 Jordan St
- 3822 Greentree Dr
- 3309 Skillman Ave
- 3305 1st St
- 3347 3rd St
- 3843 Sally Ln
- 3530 Long Beach Rd Unit 70
- 3616 Lorrie Dr
- 3638 Lorrie Dr
- 3615 Annette Dr
- 3609 Annette Dr
- 3604 Lorrie Dr
- 3627 Lorrie Dr
- 3635 Lorrie Dr
- 3623 Lorrie Dr
- 3598 Lorrie Dr
- 3637 Mahlon Brower Dr
- 3639 Lorrie Dr
- 3653 Mahlon Brower Dr
- 3619 Lorrie Dr
- 3647 Lorrie Dr
- 3603 Annette Dr
- 3615 Lorrie Dr
- 3597 Lorrie Dr
- 3603 Lorrie Dr
- 3597 Annette Dr
- 3609 Lorrie Dr