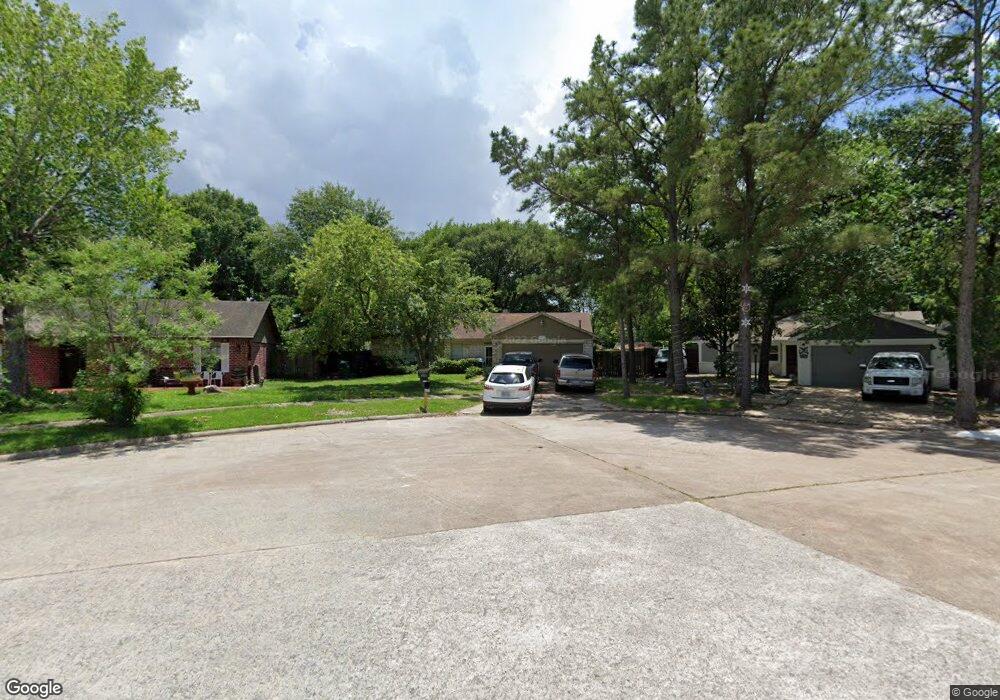
3627 Mckinley Ln Houston, TX 77088
Greater Inwood NeighborhoodEstimated Value: $210,000 - $221,328
3
Beds
2
Baths
1,464
Sq Ft
$147/Sq Ft
Est. Value
About This Home
This home is located at 3627 Mckinley Ln, Houston, TX 77088 and is currently estimated at $215,332, approximately $147 per square foot. 3627 Mckinley Ln is a home located in Harris County with nearby schools including Stovall School, Caraway Intermediate School, and Caraway Elementary School.
Ownership History
Date
Name
Owned For
Owner Type
Purchase Details
Closed on
Aug 29, 2012
Sold by
2011 Homes Llc
Bought by
Flores Jorge E
Current Estimated Value
Home Financials for this Owner
Home Financials are based on the most recent Mortgage that was taken out on this home.
Original Mortgage
$86,750
Outstanding Balance
$59,999
Interest Rate
3.56%
Mortgage Type
Seller Take Back
Estimated Equity
$155,333
Purchase Details
Closed on
Dec 12, 2011
Sold by
Citimortgage Inc
Bought by
2011 Homes Llc
Purchase Details
Closed on
Nov 1, 2011
Sold by
Martin Jannet L
Bought by
Citimortgage Inc
Purchase Details
Closed on
May 22, 1998
Sold by
Broughton Mary Lynn
Bought by
Martin Jannet L
Home Financials for this Owner
Home Financials are based on the most recent Mortgage that was taken out on this home.
Original Mortgage
$42,947
Interest Rate
7.22%
Mortgage Type
FHA
Create a Home Valuation Report for This Property
The Home Valuation Report is an in-depth analysis detailing your home's value as well as a comparison with similar homes in the area
Home Values in the Area
Average Home Value in this Area
Purchase History
| Date | Buyer | Sale Price | Title Company |
|---|---|---|---|
| Flores Jorge E | -- | -- | |
| Flores Jorge E | -- | -- | |
| 2011 Homes Llc | -- | First American Title | |
| Citimortgage Inc | $38,800 | None Available | |
| Martin Jannet L | -- | -- |
Source: Public Records
Mortgage History
| Date | Status | Borrower | Loan Amount |
|---|---|---|---|
| Open | Flores Jorge E | $86,750 | |
| Closed | Flores Jorge E | $86,750 | |
| Previous Owner | Martin Jannet L | $42,947 |
Source: Public Records
Tax History Compared to Growth
Tax History
| Year | Tax Paid | Tax Assessment Tax Assessment Total Assessment is a certain percentage of the fair market value that is determined by local assessors to be the total taxable value of land and additions on the property. | Land | Improvement |
|---|---|---|---|---|
| 2025 | $1,172 | $194,356 | $50,826 | $143,530 |
| 2024 | $1,172 | $205,708 | $50,826 | $154,882 |
| 2023 | $1,172 | $224,938 | $50,826 | $174,112 |
| 2022 | $2,149 | $193,218 | $42,651 | $150,567 |
| 2021 | $2,046 | $159,450 | $35,543 | $123,907 |
| 2020 | $1,955 | $130,000 | $35,543 | $94,457 |
| 2019 | $1,863 | $109,292 | $18,482 | $90,810 |
| 2018 | $520 | $109,292 | $18,482 | $90,810 |
| 2017 | $1,476 | $109,292 | $18,482 | $90,810 |
| 2016 | $1,342 | $109,292 | $18,482 | $90,810 |
| 2015 | $808 | $93,493 | $18,482 | $75,011 |
| 2014 | $808 | $79,003 | $18,482 | $60,521 |
Source: Public Records
Map
Nearby Homes
- 7702 Inwood Hills Ln
- 7717 Inwood Hills Ln
- 7709 Inwood Hills Ln
- 7712 Inwood Grove Ln
- 7716 Inwood Grove Ln
- 7814 Inwood Grove Ln
- 7718 Inwood Grove Ln
- 7808 Inwood Grove Ln
- 7707 Inwood Grove Ln
- DOVE Plan at Alaia Crossing
- CEDAR Plan at Alaia Crossing
- BOXWOOD Plan at Alaia Crossing
- 7705 Inwood Grove Ln
- 7816 Inwood Grove Ln
- 7610 Alperton Dr
- 3522 Almington Ln
- 8518 Wild Basin Dr
- 8510 Woodcamp Dr
- 7726 Ashmole Ln
- 7611 Athlone Dr
- 7703 Alperton Dr
- 3623 Mckinley Ln
- 3622 Sardis Ln
- 3618 Sardis Ln
- 7707 Alperton Dr
- 7631 Alperton Dr
- 3619 Mckinley Ln
- 3614 Sardis Ln
- 7711 Alperton Dr
- 7710 Alperton Dr
- 3615 Mckinley Ln
- 7627 Alperton Dr
- 7715 Alperton Dr
- 3610 Sardis Ln
- 7714 Alperton Dr
- 3611 Mckinley Ln
- 7628 Inwood Hills Ln
- 3618 Mckinley Ln
- 7623 Alperton Dr
- 3615 Sardis Ln