3627 S 100 W Bountiful, UT 84010
Estimated Value: $1,381,000 - $2,098,000
5
Beds
5
Baths
7,581
Sq Ft
$213/Sq Ft
Est. Value
About This Home
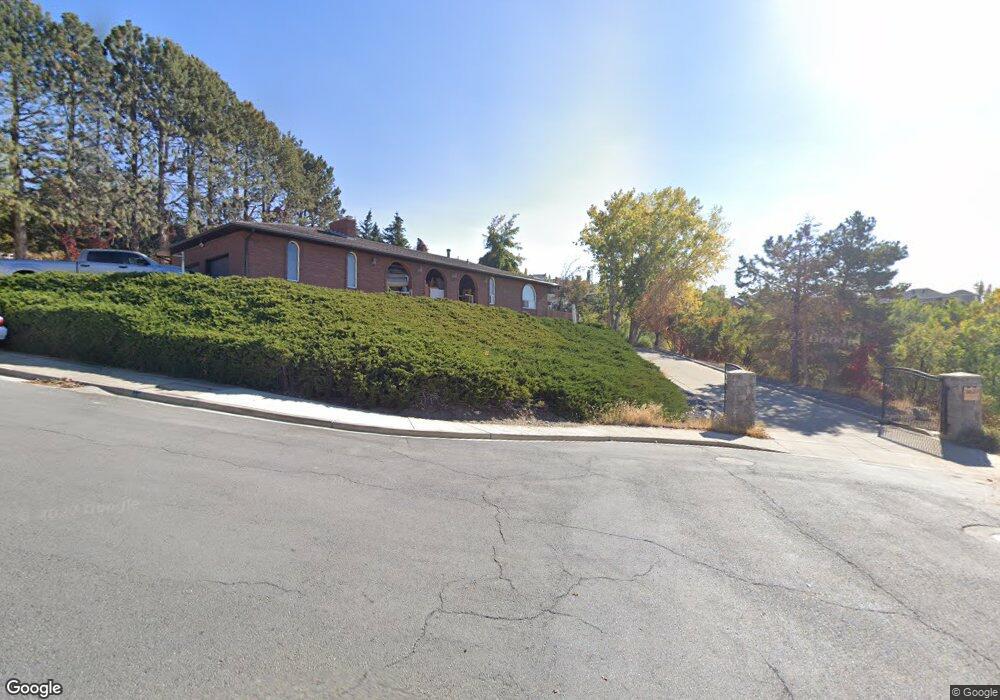
This home is located at 3627 S 100 W, Bountiful, UT 84010 and is currently estimated at $1,613,955, approximately $212 per square foot. 3627 S 100 W is a home located in Davis County with nearby schools including Boulton School, South Davis Junior High School, and Woods Cross High School.
Ownership History
Date
Name
Owned For
Owner Type
Purchase Details
Closed on
Oct 28, 2020
Sold by
Smith Utah Rentals Llc
Bought by
Hoskins Kameron
Current Estimated Value
Home Financials for this Owner
Home Financials are based on the most recent Mortgage that was taken out on this home.
Original Mortgage
$646,300
Outstanding Balance
$573,802
Interest Rate
2.8%
Mortgage Type
Purchase Money Mortgage
Estimated Equity
$1,040,154
Purchase Details
Closed on
Jun 3, 2010
Sold by
Smith Lane F
Bought by
Smith Utah Rentals Llc
Purchase Details
Closed on
Dec 15, 2008
Sold by
Smith Lane Fielding
Bought by
Smith Lane F and The Lane F Smith Trust
Purchase Details
Closed on
Apr 4, 2003
Sold by
Cantil P C and Cantil Kris
Bought by
Fairbanks Capital Corp
Purchase Details
Closed on
Dec 4, 2001
Sold by
Cantil P C and Cantil Kris
Bought by
Homecomings Financial Network
Create a Home Valuation Report for This Property
The Home Valuation Report is an in-depth analysis detailing your home's value as well as a comparison with similar homes in the area
Purchase History
| Date | Buyer | Sale Price | Title Company |
|---|---|---|---|
| Hoskins Kameron | -- | Pinnacle Title Ins Age | |
| Smith Utah Rentals Llc | -- | None Available | |
| Smith Lane F | -- | None Available | |
| Fairbanks Capital Corp | $585,000 | Backman Stewart Title Servic | |
| Homecomings Financial Network | $585,000 | Backman Stewart Title Servic |
Source: Public Records
Mortgage History
| Date | Status | Borrower | Loan Amount |
|---|---|---|---|
| Open | Hoskins Kameron | $646,300 |
Source: Public Records
Tax History
| Year | Tax Paid | Tax Assessment Tax Assessment Total Assessment is a certain percentage of the fair market value that is determined by local assessors to be the total taxable value of land and additions on the property. | Land | Improvement |
|---|---|---|---|---|
| 2025 | $9,672 | $818,921 | $538,173 | $280,748 |
| 2024 | $10,645 | $719,399 | $535,570 | $183,829 |
| 2023 | $10,445 | $697,950 | $556,992 | $140,957 |
| 2022 | $10,361 | $1,300,000 | $958,085 | $341,915 |
| 2021 | $9,867 | $1,012,000 | $799,336 | $212,664 |
| 2020 | $7,840 | $799,000 | $525,796 | $273,204 |
| 2019 | $7,606 | $780,000 | $425,028 | $354,972 |
| 2018 | $7,159 | $724,000 | $393,411 | $330,589 |
| 2016 | $5,828 | $465,814 | $293,968 | $171,846 |
| 2015 | $6,197 | $468,399 | $293,968 | $174,431 |
| 2014 | $5,804 | $448,690 | $293,968 | $154,722 |
| 2013 | -- | $368,881 | $168,805 | $200,076 |
Source: Public Records
Map
Nearby Homes
- 8 E 3500 S
- 11 E Bonneville Dr
- 3291 S 300 W
- 336 W 3500 S
- 3864 S Monarch Dr E
- 3551 S Huntington Dr
- 4302 S Monarch Dr E
- 424 E Canyon Estates Dr S
- 166 E 3000 S
- 14 E Fairway Dr
- 53 N Foxhill Rd
- 14 N Fairway Dr
- 184 Wood Hill Ln
- 468 W 3200 S
- 3345 Canyon Estates Dr
- 101 W 2800 S
- 337 W 2900 S
- 367 Hidden Lake Dr
- 348 Hidden Lake Dr
- 348 Hidden Lake Dr Unit 107
Your Personal Tour Guide
Ask me questions while you tour the home.