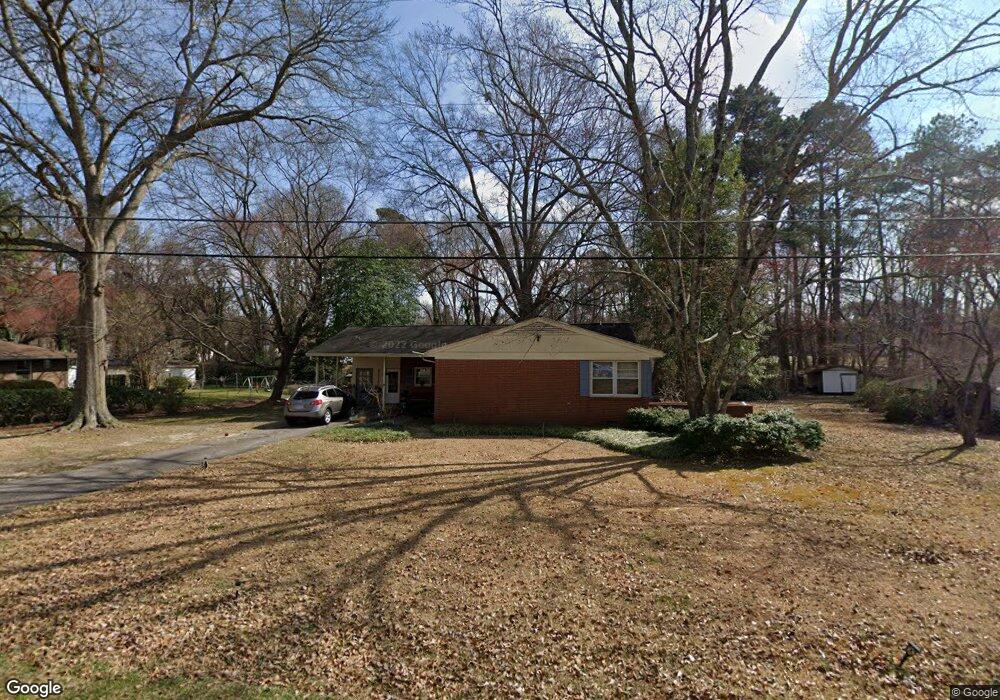
3628 Bond St Raleigh, NC 27604
Northeast Raleigh NeighborhoodEstimated Value: $294,173 - $336,000
3
Beds
3
Baths
1,382
Sq Ft
$226/Sq Ft
Est. Value
About This Home
This home is located at 3628 Bond St, Raleigh, NC 27604 and is currently estimated at $312,543, approximately $226 per square foot. 3628 Bond St is a home located in Wake County with nearby schools including Wilburn Elementary, Durant Road Middle, and Millbrook High School.
Ownership History
Date
Name
Owned For
Owner Type
Purchase Details
Closed on
Jun 4, 2003
Sold by
Hodges Virginia A
Bought by
Hodges Virginia A
Current Estimated Value
Purchase Details
Closed on
Sep 26, 2002
Sold by
Ballance Robert Michael and Ballance Robin Elaine
Bought by
Hodges Virginia A
Home Financials for this Owner
Home Financials are based on the most recent Mortgage that was taken out on this home.
Original Mortgage
$103,000
Outstanding Balance
$43,277
Interest Rate
6.19%
Estimated Equity
$269,266
Create a Home Valuation Report for This Property
The Home Valuation Report is an in-depth analysis detailing your home's value as well as a comparison with similar homes in the area
Home Values in the Area
Average Home Value in this Area
Purchase History
| Date | Buyer | Sale Price | Title Company |
|---|---|---|---|
| Hodges Virginia A | -- | -- | |
| Hodges Virginia A | $123,000 | -- |
Source: Public Records
Mortgage History
| Date | Status | Borrower | Loan Amount |
|---|---|---|---|
| Open | Hodges Virginia A | $103,000 |
Source: Public Records
Tax History Compared to Growth
Tax History
| Year | Tax Paid | Tax Assessment Tax Assessment Total Assessment is a certain percentage of the fair market value that is determined by local assessors to be the total taxable value of land and additions on the property. | Land | Improvement |
|---|---|---|---|---|
| 2025 | $1,677 | $259,128 | $105,000 | $154,128 |
| 2024 | $1,629 | $259,128 | $105,000 | $154,128 |
| 2023 | $1,398 | $176,781 | $50,000 | $126,781 |
| 2022 | $1,297 | $176,781 | $50,000 | $126,781 |
| 2021 | $1,262 | $176,781 | $50,000 | $126,781 |
| 2020 | $1,242 | $176,781 | $50,000 | $126,781 |
| 2019 | $1,069 | $128,485 | $42,000 | $86,485 |
| 2018 | $984 | $128,485 | $42,000 | $86,485 |
| 2017 | $934 | $128,485 | $42,000 | $86,485 |
| 2016 | $915 | $128,485 | $42,000 | $86,485 |
| 2015 | $1,028 | $145,089 | $54,000 | $91,089 |
| 2014 | $975 | $145,089 | $54,000 | $91,089 |
Source: Public Records
Map
Nearby Homes
- 1809 Billingham Ct
- 2023 Seneca Dr
- 3521 Piedmont Dr
- 2316 Carthage Cir
- Ellerbe Plan at Piedmont Point
- 3455 Piedmont Dr
- 2108 Carthage Cir
- 2103 Kilburn Rd
- 2209 Dobbin Place
- 3601 Elm Grove Ln
- 3607 Elm Grove Ln
- 3213 Marie Dr
- 3225 Marie Dr
- 4225 Lake Woodard Dr
- 2311 Oakwood Meadows Ct
- 2301 Oakwood Meadows Ct
- 2303 Oakwood Meadows Ct
- 4212 Beacon Crest Way
- 2305 Oakwood Meadows Ct
- 2307 Oakwood Meadows Ct