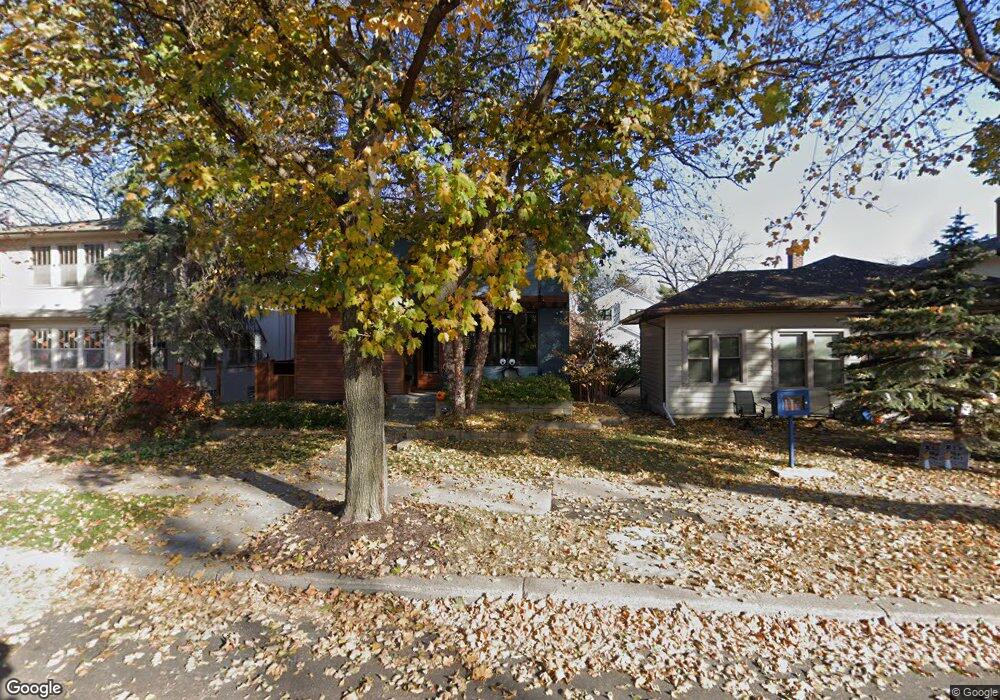
3629 Dupont Ave S Minneapolis, MN 55409
East Harriet NeighborhoodEstimated Value: $634,000 - $967,695
4
Beds
4
Baths
2,044
Sq Ft
$427/Sq Ft
Est. Value
About This Home
This home is located at 3629 Dupont Ave S, Minneapolis, MN 55409 and is currently estimated at $873,674, approximately $427 per square foot. 3629 Dupont Ave S is a home located in Hennepin County with nearby schools including Barton Elementary School, Justice Page Middle School, and Washburn High School.
Ownership History
Date
Name
Owned For
Owner Type
Purchase Details
Closed on
Mar 29, 2017
Sold by
Davis Matthew Harrison Shaw and Davis Ines Langrock
Bought by
Langrock Arno Stefan and Langrock Ursula Renate
Current Estimated Value
Purchase Details
Closed on
Apr 12, 2013
Sold by
Davis Matthew H S and Davis Ines L
Bought by
Davis Matthew H S and Davis Ines L
Home Financials for this Owner
Home Financials are based on the most recent Mortgage that was taken out on this home.
Original Mortgage
$175,500
Outstanding Balance
$37,135
Interest Rate
3.5%
Mortgage Type
New Conventional
Estimated Equity
$836,539
Purchase Details
Closed on
Jul 31, 2003
Sold by
Hawes Andrew T
Bought by
Davis Matthew H S
Purchase Details
Closed on
Dec 31, 2002
Sold by
Bargfrede Blaine C
Bought by
Tehrani Mohammad A
Purchase Details
Closed on
May 30, 1997
Sold by
Desbois Frederic and Desbois Barbra A
Bought by
Hawes Andrew T
Create a Home Valuation Report for This Property
The Home Valuation Report is an in-depth analysis detailing your home's value as well as a comparison with similar homes in the area
Home Values in the Area
Average Home Value in this Area
Purchase History
| Date | Buyer | Sale Price | Title Company |
|---|---|---|---|
| Langrock Arno Stefan | -- | None Available | |
| Davis Matthew H S | -- | Title One Inc | |
| Davis Matthew H S | $205,000 | -- | |
| Tehrani Mohammad A | $450,000 | -- | |
| Hawes Andrew T | $89,000 | -- |
Source: Public Records
Mortgage History
| Date | Status | Borrower | Loan Amount |
|---|---|---|---|
| Open | Davis Matthew H S | $175,500 |
Source: Public Records
Tax History Compared to Growth
Tax History
| Year | Tax Paid | Tax Assessment Tax Assessment Total Assessment is a certain percentage of the fair market value that is determined by local assessors to be the total taxable value of land and additions on the property. | Land | Improvement |
|---|---|---|---|---|
| 2024 | $13,892 | $854,000 | $207,000 | $647,000 |
| 2023 | $12,749 | $889,000 | $207,000 | $682,000 |
| 2022 | $10,990 | $839,000 | $161,000 | $678,000 |
| 2021 | $9,490 | $739,000 | $155,000 | $584,000 |
| 2020 | $10,048 | $671,500 | $113,000 | $558,500 |
| 2019 | $9,771 | $658,500 | $104,400 | $554,100 |
| 2018 | $8,888 | $627,000 | $104,400 | $522,600 |
| 2017 | $2,748 | $114,900 | $94,900 | $20,000 |
| 2016 | $2,548 | $178,500 | $94,900 | $83,600 |
| 2015 | $2,750 | $178,500 | $94,900 | $83,600 |
| 2014 | -- | $166,000 | $89,700 | $76,300 |
Source: Public Records
Map
Nearby Homes
- 3513 Emerson Ave S
- 3501 Dupont Ave S Unit 1
- 3603 Aldrich Ave S Unit 200
- 3643 Lyndale Ave S
- 3428 Emerson Ave S Unit 6
- 3448 Girard Ave S
- 3540 Harriet Ave Unit 2
- 3421 Hennepin Ave Unit 5
- 3909 Aldrich Ave S Unit 3
- 3443 Garfield Ave
- 3329 Girard Ave S
- 3514 Grand Ave S
- 3416 Holmes Ave
- 1010 W 33rd St
- 3502 Grand Ave S
- 3321 Hennepin Ave
- 3248 Emerson Ave S Unit 1
- 3233 Fremont Ave S Unit 3
- 3237 Lyndale Ave S
- 3236 Hennepin Ave
- 3625 Dupont Ave S
- 3633 Dupont Ave S
- 3637 Dupont Ave S
- 3617 Dupont Ave S
- 3641 Dupont Ave S
- 3624 Colfax Ave S Unit 201
- 3624 Colfax Ave S Unit 101
- 3624 Colfax Ave S Unit 202
- 3624 Colfax Ave S Unit 102
- 3624 3624 S Colfax-Avenue-s
- 3624 3624 Colfax-Avenue-s
- 3632 Colfax Ave S
- 3626 Colfax Ave S
- 3628 Colfax Ave S
- 3630 Colfax Ave S
- 3636 Colfax Ave S
- 3613 Dupont Ave S
- 3645 Dupont Ave S
- 3620 Colfax Ave S
- 3620 Colfax Ave S Unit Upper