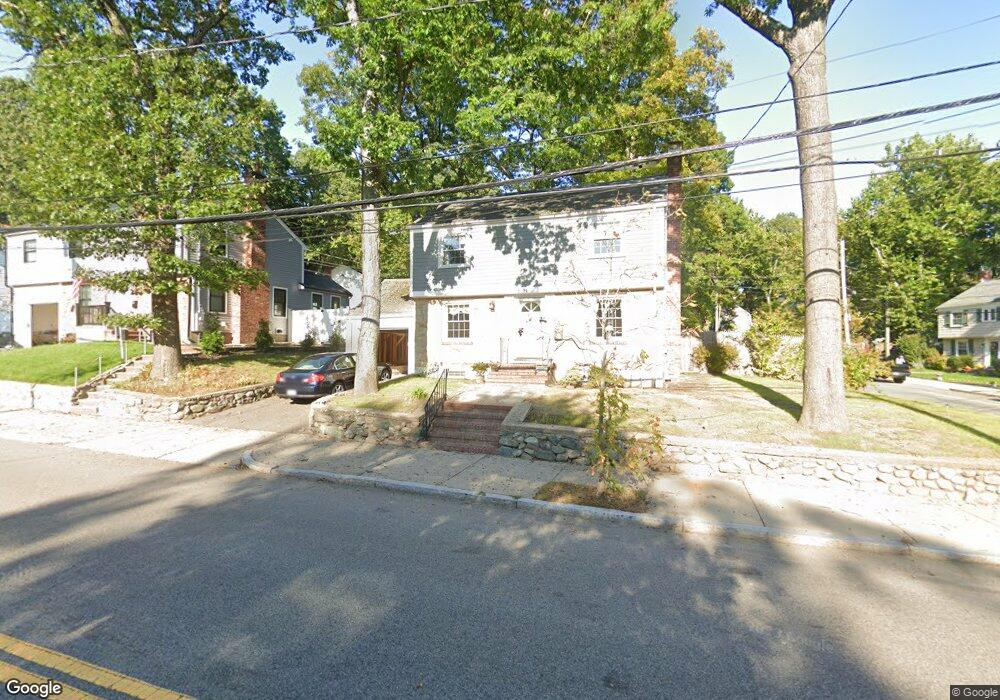
363 Corey St West Roxbury, MA 02132
West Roxbury NeighborhoodEstimated Value: $707,000 - $805,000
2
Beds
1
Bath
1,260
Sq Ft
$610/Sq Ft
Est. Value
About This Home
This home is located at 363 Corey St, West Roxbury, MA 02132 and is currently estimated at $768,136, approximately $609 per square foot. 363 Corey St is a home located in Suffolk County with nearby schools including Holy Name Parish School, St Theresa School, and Catholic Memorial School.
Ownership History
Date
Name
Owned For
Owner Type
Purchase Details
Closed on
Feb 7, 2023
Sold by
Donnelly John D
Bought by
363 Corey Street Rt
Current Estimated Value
Purchase Details
Closed on
Jun 5, 1992
Sold by
Paolini Donald J
Bought by
Roache John P
Home Financials for this Owner
Home Financials are based on the most recent Mortgage that was taken out on this home.
Original Mortgage
$100,000
Interest Rate
8.8%
Mortgage Type
Purchase Money Mortgage
Create a Home Valuation Report for This Property
The Home Valuation Report is an in-depth analysis detailing your home's value as well as a comparison with similar homes in the area
Home Values in the Area
Average Home Value in this Area
Purchase History
| Date | Buyer | Sale Price | Title Company |
|---|---|---|---|
| 363 Corey Street Rt | -- | None Available | |
| Roache John P | $140,000 | -- |
Source: Public Records
Mortgage History
| Date | Status | Borrower | Loan Amount |
|---|---|---|---|
| Previous Owner | Roache John P | $100,000 |
Source: Public Records
Tax History Compared to Growth
Tax History
| Year | Tax Paid | Tax Assessment Tax Assessment Total Assessment is a certain percentage of the fair market value that is determined by local assessors to be the total taxable value of land and additions on the property. | Land | Improvement |
|---|---|---|---|---|
| 2025 | $8,122 | $701,400 | $240,100 | $461,300 |
| 2024 | $7,668 | $703,500 | $253,100 | $450,400 |
| 2023 | $7,333 | $682,800 | $245,700 | $437,100 |
| 2022 | $6,753 | $620,700 | $223,300 | $397,400 |
| 2021 | $6,191 | $580,200 | $212,700 | $367,500 |
| 2020 | $5,772 | $546,600 | $198,900 | $347,700 |
| 2019 | $5,538 | $525,400 | $160,700 | $364,700 |
| 2018 | $5,100 | $486,600 | $160,700 | $325,900 |
| 2017 | $5,049 | $476,800 | $160,700 | $316,100 |
| 2016 | $4,857 | $441,500 | $160,700 | $280,800 |
| 2015 | $5,234 | $432,200 | $177,600 | $254,600 |
| 2014 | $4,793 | $381,000 | $177,600 | $203,400 |
Source: Public Records
Map
Nearby Homes
- 701 Vfw Pkwy
- 139 Newfield St
- 845 Lagrange St Unit 4
- 865 Lagrange St Unit 5
- 931 Lagrange St
- 23 Westgate Rd Unit 6
- 89 Dwinell St
- 168 Maple St
- 1307 Lagrange St Unit 1307
- 42 Bryon Rd Unit 6
- 76 Vermont St
- 21 Westgate Rd Unit 6
- 57 Broadlawn Park Unit 4B
- 64 Bryon Rd Unit 1
- 579 Baker St Unit 579
- 44 Broadlawn Park Unit 22
- 577 Baker St Unit 577
- 9 Carroll St
- 331 Vermont St
- 72 Wallis Rd