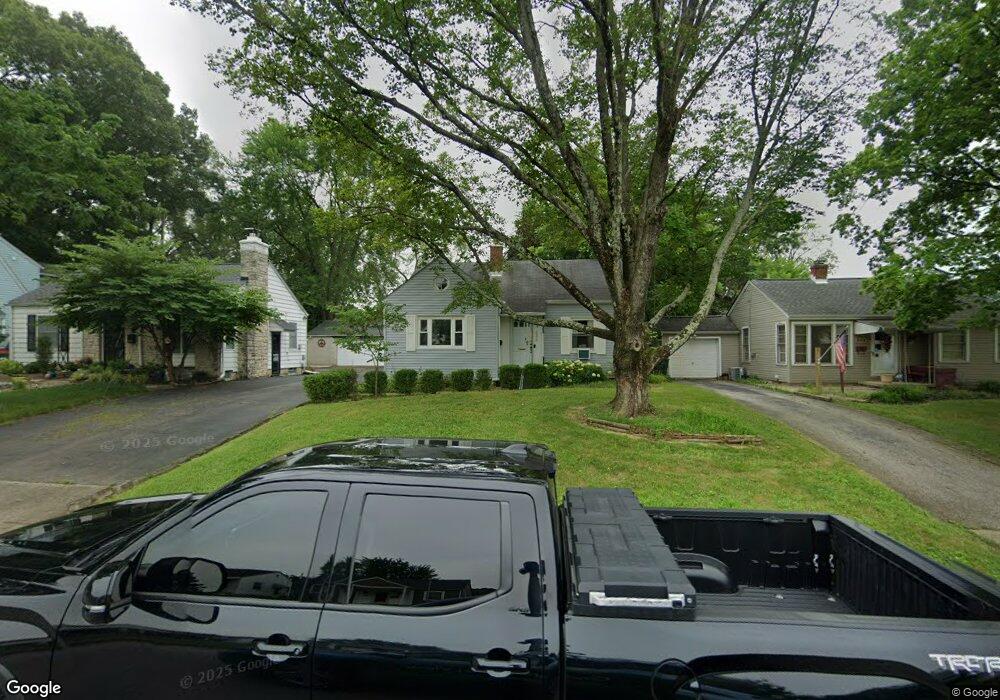
363 E Beechwold Blvd Columbus, OH 43214
Clintonville NeighborhoodEstimated Value: $331,000 - $377,000
2
Beds
2
Baths
1,316
Sq Ft
$268/Sq Ft
Est. Value
About This Home
This home is located at 363 E Beechwold Blvd, Columbus, OH 43214 and is currently estimated at $352,477, approximately $267 per square foot. 363 E Beechwold Blvd is a home located in Franklin County with nearby schools including Indian Springs Elementary School, Dominion Middle School, and Whetstone High School.
Ownership History
Date
Name
Owned For
Owner Type
Purchase Details
Closed on
Feb 17, 2016
Sold by
Campbell Matthew L and Campbell Wendy D
Bought by
Duncan Carmen R
Current Estimated Value
Home Financials for this Owner
Home Financials are based on the most recent Mortgage that was taken out on this home.
Original Mortgage
$117,139
Outstanding Balance
$93,668
Interest Rate
4.37%
Mortgage Type
FHA
Estimated Equity
$258,809
Purchase Details
Closed on
Oct 20, 2003
Sold by
Campbell Gary L and Campbell Judith
Bought by
Campbell Matthew L and Campbell Wendy D
Home Financials for this Owner
Home Financials are based on the most recent Mortgage that was taken out on this home.
Original Mortgage
$107,200
Interest Rate
5%
Mortgage Type
Purchase Money Mortgage
Purchase Details
Closed on
Jul 12, 1999
Sold by
Locke Robert A
Bought by
Campbell Gary L and Campbell Judith
Home Financials for this Owner
Home Financials are based on the most recent Mortgage that was taken out on this home.
Original Mortgage
$104,800
Interest Rate
7.54%
Purchase Details
Closed on
May 25, 1989
Bought by
Locke Robert A
Create a Home Valuation Report for This Property
The Home Valuation Report is an in-depth analysis detailing your home's value as well as a comparison with similar homes in the area
Home Values in the Area
Average Home Value in this Area
Purchase History
| Date | Buyer | Sale Price | Title Company |
|---|---|---|---|
| Duncan Carmen R | -- | None Available | |
| Campbell Matthew L | $134,000 | Advantage One Title Agency I | |
| Campbell Gary L | $131,000 | Connor Title Co | |
| Locke Robert A | $72,000 | -- |
Source: Public Records
Mortgage History
| Date | Status | Borrower | Loan Amount |
|---|---|---|---|
| Open | Duncan Carmen R | $117,139 | |
| Previous Owner | Campbell Matthew L | $107,200 | |
| Previous Owner | Campbell Gary L | $104,800 |
Source: Public Records
Tax History
| Year | Tax Paid | Tax Assessment Tax Assessment Total Assessment is a certain percentage of the fair market value that is determined by local assessors to be the total taxable value of land and additions on the property. | Land | Improvement |
|---|---|---|---|---|
| 2025 | $4,436 | $98,840 | $46,130 | $52,710 |
| 2024 | $4,436 | $98,840 | $46,130 | $52,710 |
| 2023 | $4,379 | $98,840 | $46,130 | $52,710 |
| 2022 | $3,911 | $75,400 | $31,470 | $43,930 |
| 2021 | $4,011 | $75,400 | $31,470 | $43,930 |
| 2020 | $3,923 | $75,400 | $31,470 | $43,930 |
| 2019 | $3,633 | $59,890 | $24,190 | $35,700 |
| 2018 | $3,244 | $59,890 | $24,190 | $35,700 |
| 2017 | $3,392 | $59,890 | $24,190 | $35,700 |
| 2016 | $3,154 | $47,610 | $18,240 | $29,370 |
| 2015 | $2,863 | $47,610 | $18,240 | $29,370 |
| 2014 | $2,870 | $47,610 | $18,240 | $29,370 |
| 2013 | $1,348 | $45,325 | $17,360 | $27,965 |
Source: Public Records
Map
Nearby Homes
- 389 Wetmore Rd
- 435 E Beaumont Rd
- 144 Wetmore Rd
- 103 E Jeffrey Place
- 4938 Fairway Ct Unit 4938-4944
- 601 Morse Rd
- 53 E Beechwold Blvd
- 243 E Schreyer Place
- 4299 Colerain Ave
- 62 W Rathbone Ave
- 122 W Rathbone Ave
- 4605 Glenmawr Ave
- 827 Inwood Place
- 4464 Zeller Rd
- 899 Meadowview Dr
- 4466 Olentangy Blvd
- 325 Starrett Ct
- 5200 Fenway Ct Unit B
- 5301 Indianola Ave
- 82 Blenheim Rd
- 369 E Beechwold Blvd
- 355 E Beechwold Blvd
- 353 E Beechwold Blvd
- 375 E Beechwold Blvd
- 349 E Beechwold Blvd
- 383 E Beechwold Blvd
- 362 Wetmore Rd
- 368 Wetmore Rd
- 366 E Beechwold Blvd
- 354 Wetmore Rd
- 360 E Beechwold Blvd
- 337 E Beechwold Blvd
- 370 E Beechwold Blvd
- 354 E Beechwold Blvd
- 374 Wetmore Rd
- 376 E Beechwold Blvd
- 348 Wetmore Rd
- 391 E Beechwold Blvd
- 382 Wetmore Rd
- 382 E Beechwold Blvd
Your Personal Tour Guide
Ask me questions while you tour the home.