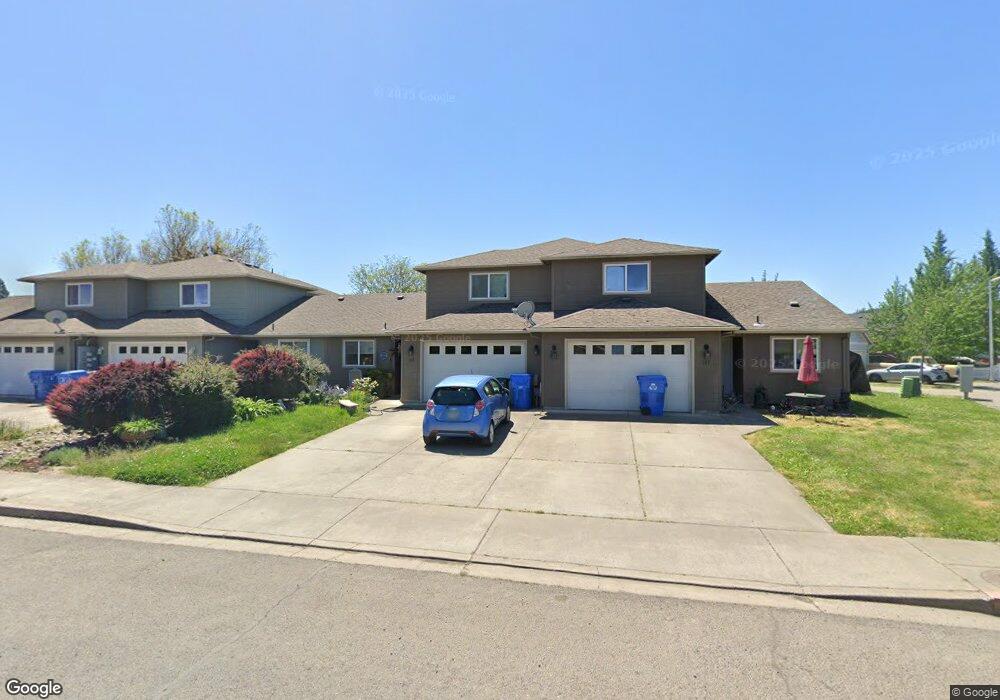
363 Fargo St Eagle Point, OR 97524
Estimated Value: $308,000 - $335,922
3
Beds
2
Baths
1,305
Sq Ft
$244/Sq Ft
Est. Value
About This Home
This home is located at 363 Fargo St, Eagle Point, OR 97524 and is currently estimated at $318,231, approximately $243 per square foot. 363 Fargo St is a home located in Jackson County with nearby schools including Eagle Point Middle School, White Mountain Middle School, and Eagle Point High School.
Ownership History
Date
Name
Owned For
Owner Type
Purchase Details
Closed on
Jul 30, 2013
Sold by
Gamboa Beatrice A
Bought by
Gamboa Beatrice A and Trust Of Beatrice A Gamboa
Current Estimated Value
Purchase Details
Closed on
Oct 29, 2004
Sold by
Barber Mark E and Barber Laura A
Bought by
Crowley William G and Gamboa Beatrice A
Home Financials for this Owner
Home Financials are based on the most recent Mortgage that was taken out on this home.
Original Mortgage
$132,000
Outstanding Balance
$60,046
Interest Rate
4.87%
Mortgage Type
Purchase Money Mortgage
Estimated Equity
$258,185
Purchase Details
Closed on
Mar 31, 2004
Sold by
Bowles Cynthia Pettit and Solenberger Loving Trust
Bought by
Barber Mark E and Barber Laura A
Home Financials for this Owner
Home Financials are based on the most recent Mortgage that was taken out on this home.
Original Mortgage
$422,160
Interest Rate
5.57%
Mortgage Type
Construction
Purchase Details
Closed on
Nov 14, 2003
Sold by
Bennett Karel R
Bought by
Pettit Solenberger Alma I and Pettit Bowles Cynthia
Create a Home Valuation Report for This Property
The Home Valuation Report is an in-depth analysis detailing your home's value as well as a comparison with similar homes in the area
Home Values in the Area
Average Home Value in this Area
Purchase History
| Date | Buyer | Sale Price | Title Company |
|---|---|---|---|
| Gamboa Beatrice A | -- | None Available | |
| Crowley William G | $165,000 | Lawyers Title Ins | |
| Barber Mark E | $175,000 | Lawyers Title Ins | |
| Pettit Solenberger Alma I | -- | -- |
Source: Public Records
Mortgage History
| Date | Status | Borrower | Loan Amount |
|---|---|---|---|
| Open | Crowley William G | $132,000 | |
| Previous Owner | Barber Mark E | $422,160 | |
| Closed | Crowley William G | $20,000 |
Source: Public Records
Tax History
| Year | Tax Paid | Tax Assessment Tax Assessment Total Assessment is a certain percentage of the fair market value that is determined by local assessors to be the total taxable value of land and additions on the property. | Land | Improvement |
|---|---|---|---|---|
| 2026 | $2,031 | $149,260 | -- | -- |
| 2025 | $1,983 | $144,920 | $47,400 | $97,520 |
| 2024 | $1,983 | $140,700 | $46,020 | $94,680 |
| 2023 | $1,916 | $136,610 | $44,680 | $91,930 |
| 2022 | $1,864 | $136,610 | $44,680 | $91,930 |
| 2021 | $1,809 | $132,640 | $43,380 | $89,260 |
| 2020 | $1,921 | $128,780 | $42,120 | $86,660 |
| 2019 | $1,892 | $121,390 | $39,700 | $81,690 |
| 2018 | $1,856 | $117,860 | $38,550 | $79,310 |
| 2017 | $1,810 | $117,860 | $38,550 | $79,310 |
| 2016 | $1,775 | $111,100 | $36,340 | $74,760 |
| 2015 | $1,717 | $111,100 | $36,340 | $74,760 |
| 2014 | $1,668 | $104,730 | $34,250 | $70,480 |
Source: Public Records
Map
Nearby Homes
- 650 Sarah Ln
- 0 Crater Lake Hwy
- 0 Sf Little Butte Unit 220204792
- 620 S Royal Ave
- 133 Edith Cir
- 522 Meadow Ln
- 10569 Hannon Rd
- 250 Tierra Cir
- 1065 S Shasta Ave
- 124 Paxon Ave
- 1288 S Shasta Ave
- 888 Arrowhead Trail
- 468 Merlee Cir
- 284 E Main St
- 1314 S Shasta Ave Unit A
- 959 Pumpkin Ridge Dr
- 421 Stevens Rd Unit 20
- 421 Stevens Rd Unit 14
- 421 Stevens Rd Unit 52
- 839 St Andrews Way
- 345 Fargo St
- 369 Fargo St
- 101 Cottonwood Dr
- 341 Fargo St
- 105 Cottonwood Dr
- 109 Cottonwood Dr
- 100 Cottonwood Dr
- 113 Cottonwood Dr
- 350 Fargo St
- 338 Fargo St
- 374 Fargo St
- 332 Fargo St
- 378 Fargo St
- 356 Fargo St
- 117 Cottonwood Dr
- 108 Cottonwood Dr
- 712 S Platt St
- 0 Cottonwood Dr
- 415 Lorraine Ave
- 112 Cottonwood Dr
Your Personal Tour Guide
Ask me questions while you tour the home.