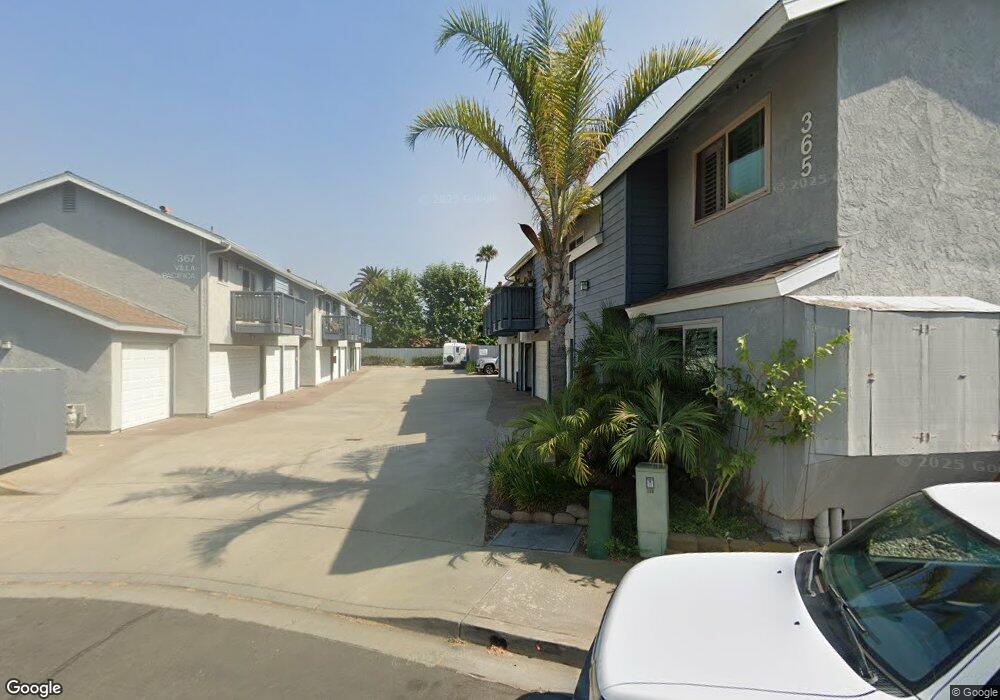
363 Hemlock Ave Unit C Carlsbad, CA 92008
North Beach NeighborhoodEstimated Value: $945,000 - $1,217,000
3
Beds
3
Baths
1,006
Sq Ft
$1,049/Sq Ft
Est. Value
About This Home
This home is located at 363 Hemlock Ave Unit C, Carlsbad, CA 92008 and is currently estimated at $1,055,496, approximately $1,049 per square foot. 363 Hemlock Ave Unit C is a home located in San Diego County with nearby schools including Carlsbad High School, Sage Creek High, and St. Patrick Catholic School.
Ownership History
Date
Name
Owned For
Owner Type
Purchase Details
Closed on
Aug 13, 2007
Sold by
Johnson Christopher W
Bought by
Fields London
Current Estimated Value
Home Financials for this Owner
Home Financials are based on the most recent Mortgage that was taken out on this home.
Original Mortgage
$320,800
Outstanding Balance
$190,538
Interest Rate
5.48%
Mortgage Type
Unknown
Estimated Equity
$864,958
Purchase Details
Closed on
Dec 19, 2006
Sold by
Johnson Lissa Anne
Bought by
Johnson Christopher W
Home Financials for this Owner
Home Financials are based on the most recent Mortgage that was taken out on this home.
Original Mortgage
$388,000
Interest Rate
7.5%
Mortgage Type
Unknown
Purchase Details
Closed on
Oct 30, 2006
Sold by
Socrates Condominium Homes Llc
Bought by
Johnson Christopher W
Home Financials for this Owner
Home Financials are based on the most recent Mortgage that was taken out on this home.
Original Mortgage
$388,000
Interest Rate
7.5%
Mortgage Type
Unknown
Create a Home Valuation Report for This Property
The Home Valuation Report is an in-depth analysis detailing your home's value as well as a comparison with similar homes in the area
Home Values in the Area
Average Home Value in this Area
Purchase History
| Date | Buyer | Sale Price | Title Company |
|---|---|---|---|
| Fields London | $401,000 | First American Title Co | |
| Johnson Christopher W | -- | Stewart Title Of Ca Inc | |
| Johnson Christopher W | $485,000 | Stewart Title Of Ca Inc |
Source: Public Records
Mortgage History
| Date | Status | Borrower | Loan Amount |
|---|---|---|---|
| Open | Fields London | $320,800 | |
| Previous Owner | Johnson Christopher W | $388,000 |
Source: Public Records
Tax History Compared to Growth
Tax History
| Year | Tax Paid | Tax Assessment Tax Assessment Total Assessment is a certain percentage of the fair market value that is determined by local assessors to be the total taxable value of land and additions on the property. | Land | Improvement |
|---|---|---|---|---|
| 2025 | $5,527 | $526,700 | $367,772 | $158,928 |
| 2024 | $5,527 | $516,373 | $360,561 | $155,812 |
| 2023 | $5,499 | $506,249 | $353,492 | $152,757 |
| 2022 | $5,414 | $496,323 | $346,561 | $149,762 |
| 2021 | $5,374 | $486,592 | $339,766 | $146,826 |
| 2020 | $5,338 | $481,604 | $336,283 | $145,321 |
| 2019 | $5,241 | $472,162 | $329,690 | $142,472 |
| 2018 | $5,020 | $462,905 | $323,226 | $139,679 |
| 2017 | $4,937 | $453,830 | $316,889 | $136,941 |
| 2016 | $4,738 | $444,932 | $310,676 | $134,256 |
| 2015 | $4,578 | $425,000 | $312,000 | $113,000 |
| 2014 | $4,590 | $425,000 | $312,000 | $113,000 |
Source: Public Records
Map
Nearby Homes
- 368 Hemlock Ave
- 385 Juniper Ave
- 370 Tamarack Ave
- 256 Juniper Ave Unit B6
- 160 Hemlock Ave
- 324 Chinquapin Ave
- 320 Chinquapin Ave
- 314 Chinquapin Ave
- 312 Chinquapin Ave
- Cherry Beach Homes Plan at Cherry Beach Homes - Cherry Beach homes
- 141 Cherry Ave
- 378 Acacia Ave
- 164 Cherry Ave
- 111 Sequoia Ave Unit C
- 334 Date Ave
- 3575 Madison St
- 157 Maple Ave
- 4009 Canario St Unit H
- 4007 Canario St Unit E
- 165 Sycamore Ave
- 363 Hemlock Ave
- 363 Hemlock Ave Unit B
- 363 Hemlock Ave Unit A
- 365 Hemlock Ave Unit E
- 365 Hemlock Ave Unit D
- 365 Hemlock Ave Unit C
- 365 Hemlock Ave Unit B
- 365 Hemlock Ave Unit A
- 355 Hemlock Ave
- 360 Redwood Ave
- 367 Hemlock Ave
- 367 Hemlock Ave Unit C
- 367 Hemlock Ave Unit B
- 367 Hemlock Ave Unit A
- 350 Redwood Ave
- 335 Hemlock Ave Unit U1
- 333 Hemlock Ave
- 331 Hemlock Ave Unit U3
- 330 Redwood Ave
- 380 Hemlock Ave