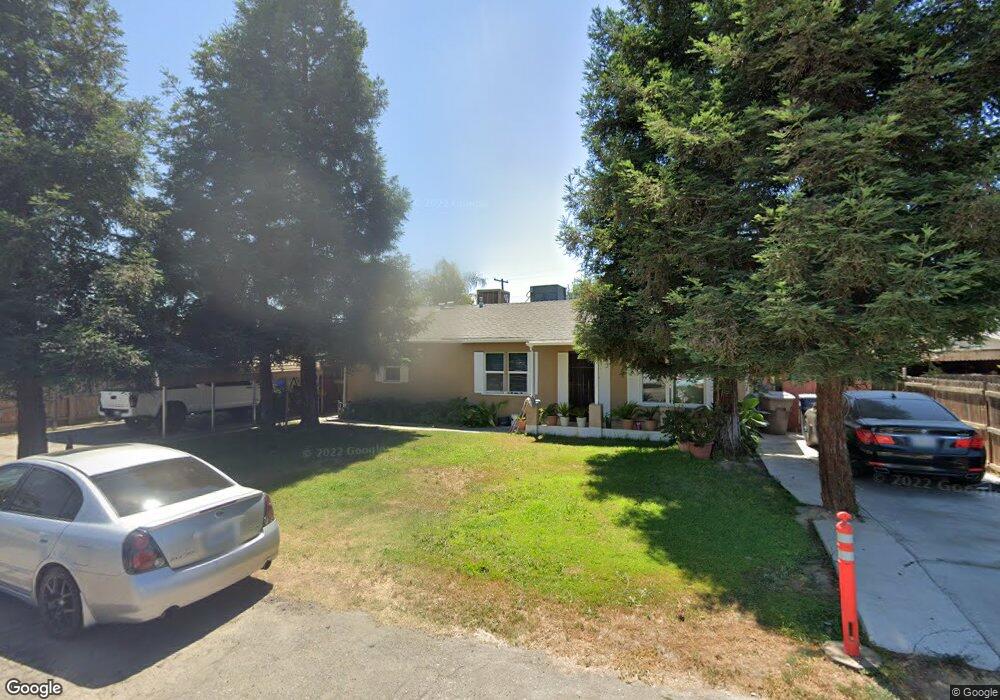
363 N Canby St Tulare, CA 93274
Northeast Tulare NeighborhoodEstimated Value: $281,000 - $316,000
3
Beds
1
Bath
1,172
Sq Ft
$250/Sq Ft
Est. Value
About This Home
This home is located at 363 N Canby St, Tulare, CA 93274 and is currently estimated at $293,578, approximately $250 per square foot. 363 N Canby St is a home located in Tulare County with nearby schools including Frank Kohn Elementary School, Live Oak Middle School, and Tulare Union High School.
Ownership History
Date
Name
Owned For
Owner Type
Purchase Details
Closed on
Jun 12, 2009
Sold by
Secretary Of Housing & Urban Development
Bought by
Hernandez Salvador and Hernandez Anita
Current Estimated Value
Home Financials for this Owner
Home Financials are based on the most recent Mortgage that was taken out on this home.
Original Mortgage
$83,842
Interest Rate
5.31%
Mortgage Type
FHA
Purchase Details
Closed on
Oct 1, 2008
Sold by
California Housing Finance Agency
Bought by
The Secretary Of Housing & Urban Develop
Purchase Details
Closed on
Sep 30, 2008
Sold by
Avalos Carina
Bought by
California Housing Finance Agency
Purchase Details
Closed on
Aug 20, 2004
Sold by
Hedgecoth Ray James
Bought by
Avalos Carina
Home Financials for this Owner
Home Financials are based on the most recent Mortgage that was taken out on this home.
Original Mortgage
$162,450
Interest Rate
5.92%
Mortgage Type
FHA
Create a Home Valuation Report for This Property
The Home Valuation Report is an in-depth analysis detailing your home's value as well as a comparison with similar homes in the area
Home Values in the Area
Average Home Value in this Area
Purchase History
| Date | Buyer | Sale Price | Title Company |
|---|---|---|---|
| Hernandez Salvador | $82,500 | Multiple | |
| The Secretary Of Housing & Urban Develop | -- | None Available | |
| California Housing Finance Agency | $169,141 | None Available | |
| Avalos Carina | $165,000 | Fidelity National Title Co |
Source: Public Records
Mortgage History
| Date | Status | Borrower | Loan Amount |
|---|---|---|---|
| Previous Owner | Hernandez Salvador | $83,842 | |
| Previous Owner | Avalos Carina | $162,450 |
Source: Public Records
Tax History Compared to Growth
Tax History
| Year | Tax Paid | Tax Assessment Tax Assessment Total Assessment is a certain percentage of the fair market value that is determined by local assessors to be the total taxable value of land and additions on the property. | Land | Improvement |
|---|---|---|---|---|
| 2025 | $1,159 | $106,490 | $51,632 | $54,858 |
| 2024 | $1,159 | $104,403 | $50,620 | $53,783 |
| 2023 | $1,130 | $102,357 | $49,628 | $52,729 |
| 2022 | $1,097 | $100,351 | $48,655 | $51,696 |
| 2021 | $1,083 | $98,383 | $47,701 | $50,682 |
| 2020 | $1,101 | $97,374 | $47,212 | $50,162 |
| 2019 | $1,128 | $95,464 | $46,286 | $49,178 |
| 2018 | $1,110 | $93,592 | $45,378 | $48,214 |
| 2017 | $1,100 | $91,757 | $44,488 | $47,269 |
| 2016 | $1,052 | $89,958 | $43,616 | $46,342 |
| 2015 | $1,016 | $88,607 | $42,961 | $45,646 |
| 2014 | $1,016 | $86,871 | $42,119 | $44,752 |
Source: Public Records
Map
Nearby Homes
- 1699 E Academy Ave
- 602 N Barranca Ct
- 3044 Isleworth Ave Unit 538 Sft
- 1687 Kaweah Dr
- 2012 Diamante Dr
- 1282 E Ben Franklin Ave
- 1280 E Richard Smith Ave
- 1160 N Laspina St
- 434 Fallbrook Ct
- 176 N Ocean Ct
- 149 S Salida Place
- 1205 Jamestown St
- 501 S Magnolia St
- 1563 E Glenwood Ave
- 9999 N Mooney
- 0 Mooney Blvd
- 1222 N Laspina St
- 717 N Mooney Blvd
- 855 E Pleasant Ave
- 861 E Sycamore Ave
- 339 N Canby St
- 1510 E Burton Ave
- 381 N Canby St
- 1495 Boyd Ct
- 1503 Boyd Ct
- 325 N Canby St
- 1496 E Burton Ave
- 354 N Canby St
- 338 N Canby St
- 384 N Canby St
- 1482 E Burton Ave
- 413 N Canby St
- 1509 E Burton Ave
- 1500 Boyd Ct
- 303 N Canby St
- 324 N Canby St
- 1487 Boyd Ct
- 398 N Canby St
- 752 N Canby St
- 1490 Boyd Ct