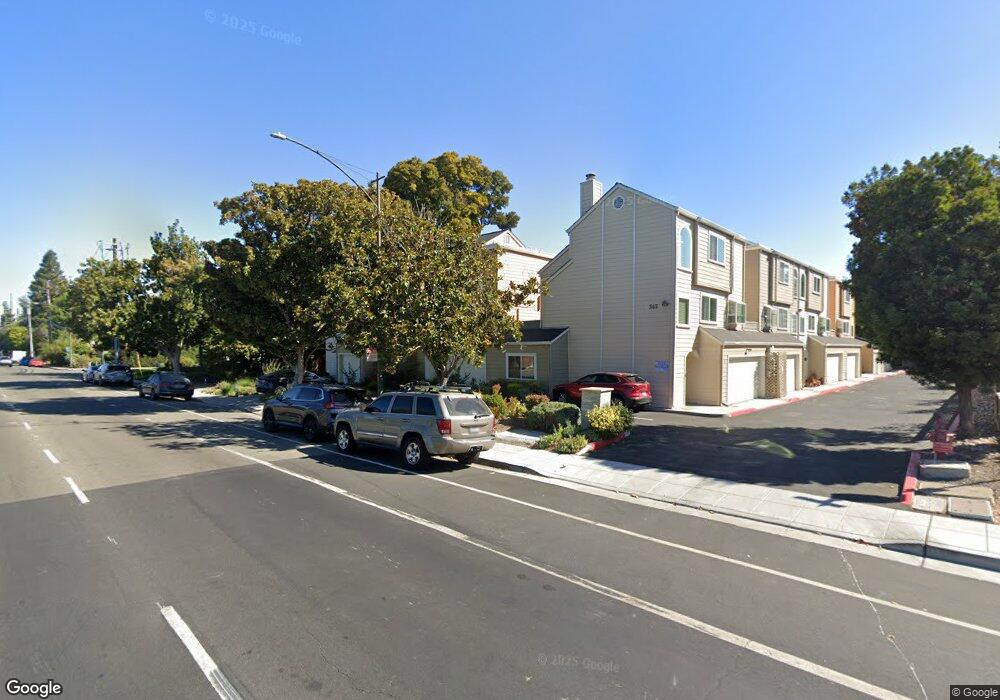
363 N Rengstorff Ave Unit 2 Mountain View, CA 94043
Monta Loma NeighborhoodEstimated Value: $1,292,000 - $1,679,000
3
Beds
2
Baths
1,560
Sq Ft
$965/Sq Ft
Est. Value
About This Home
This home is located at 363 N Rengstorff Ave Unit 2, Mountain View, CA 94043 and is currently estimated at $1,505,023, approximately $964 per square foot. 363 N Rengstorff Ave Unit 2 is a home located in Santa Clara County with nearby schools including Theuerkauf Elementary School, Crittenden Middle School, and Los Altos High School.
Ownership History
Date
Name
Owned For
Owner Type
Purchase Details
Closed on
Jul 21, 2006
Sold by
Chase Gregory M
Bought by
Chase Gregory M and Lnu Antonio
Current Estimated Value
Purchase Details
Closed on
Nov 8, 2004
Sold by
Candalla Maria Syyap and Candalla Whenny
Bought by
Chase Gregory M
Home Financials for this Owner
Home Financials are based on the most recent Mortgage that was taken out on this home.
Original Mortgage
$445,600
Interest Rate
4.5%
Mortgage Type
Purchase Money Mortgage
Purchase Details
Closed on
Nov 16, 2001
Sold by
Syyap Candalla Whenny and Syyap Candalla Maria
Bought by
Syyap Candalla Whenny and Syyap Candalla Maria
Home Financials for this Owner
Home Financials are based on the most recent Mortgage that was taken out on this home.
Original Mortgage
$260,000
Interest Rate
6.63%
Purchase Details
Closed on
Sep 28, 1994
Sold by
Current Michael Ira
Bought by
Syyap Candalla Whenny and Syyap Candalla Maria
Home Financials for this Owner
Home Financials are based on the most recent Mortgage that was taken out on this home.
Original Mortgage
$211,000
Interest Rate
4.45%
Create a Home Valuation Report for This Property
The Home Valuation Report is an in-depth analysis detailing your home's value as well as a comparison with similar homes in the area
Home Values in the Area
Average Home Value in this Area
Purchase History
| Date | Buyer | Sale Price | Title Company |
|---|---|---|---|
| Chase Gregory M | -- | None Available | |
| Chase Gregory M | $557,000 | Old Republic Title Company | |
| Syyap Candalla Whenny | -- | North American Title Co | |
| Syyap Candalla Whenny | $235,000 | Chicago Title Insurance Co |
Source: Public Records
Mortgage History
| Date | Status | Borrower | Loan Amount |
|---|---|---|---|
| Previous Owner | Chase Gregory M | $445,600 | |
| Previous Owner | Syyap Candalla Whenny | $260,000 | |
| Previous Owner | Syyap Candalla Whenny | $211,000 | |
| Closed | Chase Gregory M | $55,700 |
Source: Public Records
Tax History Compared to Growth
Tax History
| Year | Tax Paid | Tax Assessment Tax Assessment Total Assessment is a certain percentage of the fair market value that is determined by local assessors to be the total taxable value of land and additions on the property. | Land | Improvement |
|---|---|---|---|---|
| 2025 | $9,336 | $776,392 | $388,196 | $388,196 |
| 2024 | $9,336 | $761,170 | $380,585 | $380,585 |
| 2023 | $9,216 | $746,246 | $373,123 | $373,123 |
| 2022 | $9,190 | $731,614 | $365,807 | $365,807 |
| 2021 | $8,977 | $717,270 | $358,635 | $358,635 |
| 2020 | $8,924 | $709,916 | $354,958 | $354,958 |
| 2019 | $8,536 | $695,998 | $347,999 | $347,999 |
| 2018 | $8,463 | $682,352 | $341,176 | $341,176 |
| 2017 | $8,083 | $668,974 | $334,487 | $334,487 |
| 2016 | $7,840 | $655,858 | $327,929 | $327,929 |
| 2015 | $7,641 | $646,008 | $323,004 | $323,004 |
| 2014 | $7,550 | $633,354 | $316,677 | $316,677 |
Source: Public Records
Map
Nearby Homes
- 347 N Rengstorff Ave
- 363 N Rengstorff Ave Unit 5
- 700 Farley St
- 2375 Adele Ave
- 748 Cottage Ct
- 2483 Whitney Dr
- 49 Showers Dr Unit J317
- 49 Showers Dr Unit D460
- 49 Showers Dr Unit E151
- 49 Showers Dr Unit F438
- 2045 Atlas Loop
- 1542 Canna Ct
- 853B Sierra Vista Ave
- 1951 Plymouth St
- 236 Higdon Ave
- 2255 Showers Dr Unit 111
- 932 Ormonde Dr
- 1945 Mount Vernon Ct Unit 14
- 4148 Byron St
- Plan 3BZ at Amelia
- 363 N Rengstorff Ave Unit 12
- 363 N Rengstorff Ave Unit 11
- 363 N Rengstorff Ave Unit 10
- 363 N Rengstorff Ave Unit 9
- 363 N Rengstorff Ave Unit 8
- 363 N Rengstorff Ave Unit 7
- 363 N Rengstorff Ave Unit 6
- 363 N Rengstorff Ave Unit 4
- 363 N Rengstorff Ave Unit 3
- 363 N Rengstorff Ave Unit 1
- 363 N Rengstorff Ave Unit 14
- 363 N Rengstorff Ave Unit 13
- 2010 Thea Cir
- 357 N Rengstorff Ave
- 2006 Thea Cir
- 378 N Rengstorff Ave
- 374 N Rengstorff Ave
- 370 N Rengstorff Ave
- 2300 Jane Ln
- 345 N Rengstorff Ave