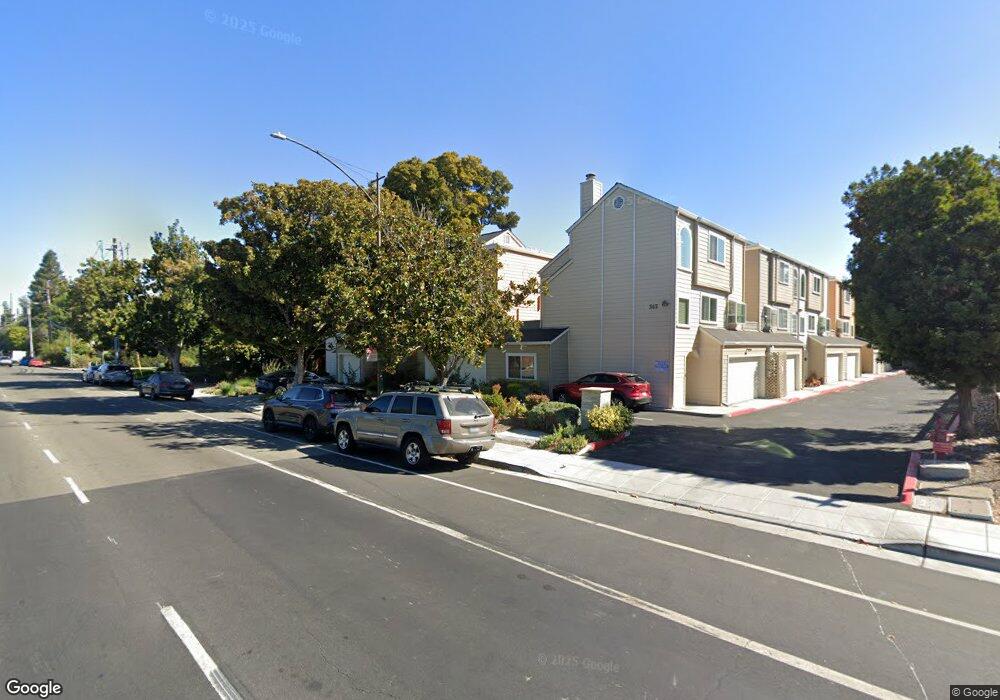
363 N Rengstorff Ave Unit 7 Mountain View, CA 94043
Monta Loma NeighborhoodEstimated Value: $1,107,387 - $1,514,000
2
Beds
2
Baths
1,234
Sq Ft
$1,026/Sq Ft
Est. Value
About This Home
This home is located at 363 N Rengstorff Ave Unit 7, Mountain View, CA 94043 and is currently estimated at $1,266,597, approximately $1,026 per square foot. 363 N Rengstorff Ave Unit 7 is a home located in Santa Clara County with nearby schools including Theuerkauf Elementary School, Crittenden Middle School, and Los Altos High School.
Ownership History
Date
Name
Owned For
Owner Type
Purchase Details
Closed on
Oct 4, 2010
Sold by
Salazar C Juan Carlos
Bought by
Calegari Maud Barbara
Current Estimated Value
Home Financials for this Owner
Home Financials are based on the most recent Mortgage that was taken out on this home.
Original Mortgage
$473,622
Outstanding Balance
$307,935
Interest Rate
4.37%
Mortgage Type
FHA
Estimated Equity
$958,662
Purchase Details
Closed on
Jun 22, 2005
Sold by
Bergstrom Karen
Bought by
Salazar C Juan Carlos
Home Financials for this Owner
Home Financials are based on the most recent Mortgage that was taken out on this home.
Original Mortgage
$124,000
Interest Rate
5.58%
Mortgage Type
Stand Alone Second
Create a Home Valuation Report for This Property
The Home Valuation Report is an in-depth analysis detailing your home's value as well as a comparison with similar homes in the area
Home Values in the Area
Average Home Value in this Area
Purchase History
| Date | Buyer | Sale Price | Title Company |
|---|---|---|---|
| Calegari Maud Barbara | $480,000 | Chicago Title Company | |
| Salazar C Juan Carlos | -- | Old Republic Title Company | |
| Bergstrom Karen | -- | Old Republic Title Company |
Source: Public Records
Mortgage History
| Date | Status | Borrower | Loan Amount |
|---|---|---|---|
| Open | Calegari Maud Barbara | $473,622 | |
| Previous Owner | Bergstrom Karen | $124,000 | |
| Previous Owner | Salazar C Juan Carlos | $496,000 |
Source: Public Records
Tax History
| Year | Tax Paid | Tax Assessment Tax Assessment Total Assessment is a certain percentage of the fair market value that is determined by local assessors to be the total taxable value of land and additions on the property. | Land | Improvement |
|---|---|---|---|---|
| 2025 | $7,453 | $614,948 | $307,474 | $307,474 |
| 2024 | $7,453 | $602,892 | $301,446 | $301,446 |
| 2023 | $7,357 | $591,072 | $295,536 | $295,536 |
| 2022 | $7,336 | $579,484 | $289,742 | $289,742 |
| 2021 | $7,167 | $568,122 | $284,061 | $284,061 |
| 2020 | $7,125 | $562,298 | $281,149 | $281,149 |
| 2019 | $6,817 | $551,274 | $275,637 | $275,637 |
| 2018 | $6,763 | $540,466 | $270,233 | $270,233 |
| 2017 | $6,462 | $529,870 | $264,935 | $264,935 |
| 2016 | $6,252 | $519,482 | $259,741 | $259,741 |
| 2015 | $6,095 | $511,680 | $255,840 | $255,840 |
| 2014 | $6,023 | $501,658 | $250,829 | $250,829 |
Source: Public Records
Map
Nearby Homes
- 347 N Rengstorff Ave
- 2064 Rialto Ct
- 290 N Rengstorff Ave
- 2047 Montecito Ave Unit 2
- 436 Sierra Vista Ave Unit 6
- 1950 Hackett Ave
- 701 N Rengstorff Ave Unit 20
- 1926 Stella St
- 765 N Rengstorff Ave Unit 19
- 2375 Adele Ave
- 2272 Towne Cir
- 70 Towne Cir
- 2483 Whitney Dr
- 2041 Atlas Loop
- 2112 Windrose Place Unit 2112
- 2235 Mora Place
- 49 Showers Dr Unit A130
- 49 Showers Dr Unit N265
- 1826 Higdon Ave
- 853B Sierra Vista Ave
- 363 N Rengstorff Ave Unit 12
- 363 N Rengstorff Ave Unit 11
- 363 N Rengstorff Ave Unit 10
- 363 N Rengstorff Ave Unit 9
- 363 N Rengstorff Ave Unit 8
- 363 N Rengstorff Ave Unit 6
- 363 N Rengstorff Ave Unit 4
- 363 N Rengstorff Ave Unit 3
- 363 N Rengstorff Ave Unit 2
- 363 N Rengstorff Ave Unit 1
- 363 N Rengstorff Ave Unit 14
- 363 N Rengstorff Ave Unit 13
- 2010 Thea Cir
- 357 N Rengstorff Ave
- 2006 Thea Cir
- 378 N Rengstorff Ave
- 374 N Rengstorff Ave
- 370 N Rengstorff Ave
- 2300 Jane Ln
- 345 N Rengstorff Ave
Your Personal Tour Guide
Ask me questions while you tour the home.