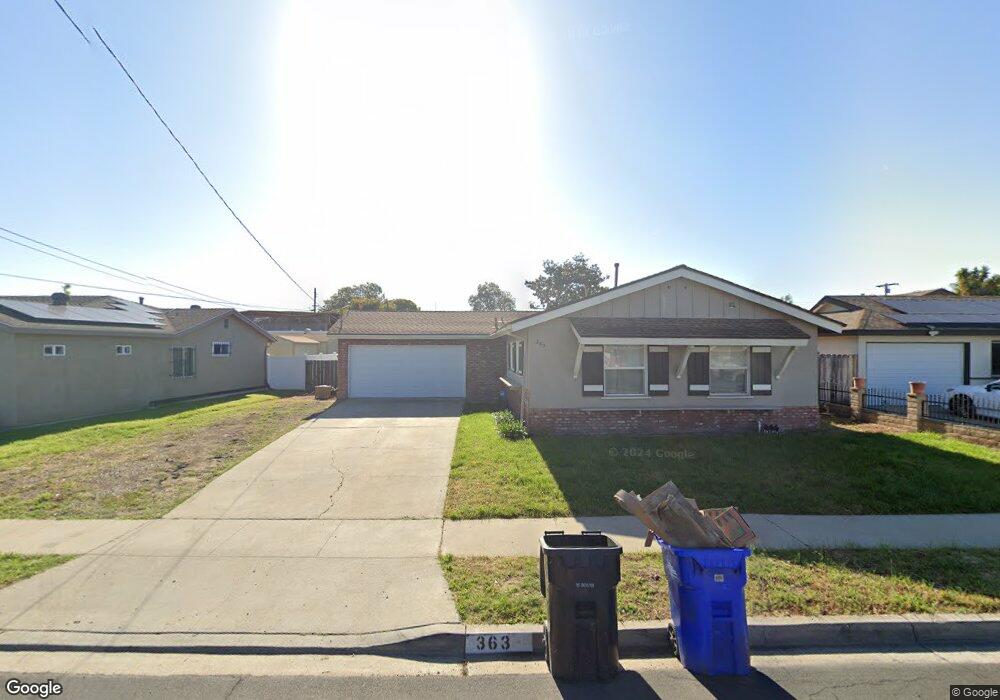
363 Northgate St San Diego, CA 92114
Bay Terraces NeighborhoodEstimated Value: $708,000 - $755,000
3
Beds
2
Baths
1,047
Sq Ft
$697/Sq Ft
Est. Value
About This Home
This home is located at 363 Northgate St, San Diego, CA 92114 and is currently estimated at $729,692, approximately $696 per square foot. 363 Northgate St is a home located in San Diego County with nearby schools including Boone Elementary School, Bell Middle School, and Morse High School.
Ownership History
Date
Name
Owned For
Owner Type
Purchase Details
Closed on
Aug 12, 2019
Sold by
Nguyen Johnny and Alejandre Kennia
Bought by
Alejandre Kennia
Current Estimated Value
Home Financials for this Owner
Home Financials are based on the most recent Mortgage that was taken out on this home.
Original Mortgage
$350,020
Outstanding Balance
$303,650
Interest Rate
3.25%
Mortgage Type
FHA
Estimated Equity
$426,042
Purchase Details
Closed on
Oct 23, 2014
Sold by
Reig Asset Management Inc
Bought by
Alejandre Kennia
Home Financials for this Owner
Home Financials are based on the most recent Mortgage that was taken out on this home.
Original Mortgage
$340,252
Interest Rate
3.62%
Mortgage Type
FHA
Purchase Details
Closed on
Jul 25, 2014
Sold by
Hadfield John W and Hadfield Shirley E
Bought by
Reig Asset Management Inc
Home Financials for this Owner
Home Financials are based on the most recent Mortgage that was taken out on this home.
Original Mortgage
$230,400
Interest Rate
4.12%
Mortgage Type
Seller Take Back
Create a Home Valuation Report for This Property
The Home Valuation Report is an in-depth analysis detailing your home's value as well as a comparison with similar homes in the area
Home Values in the Area
Average Home Value in this Area
Purchase History
| Date | Buyer | Sale Price | Title Company |
|---|---|---|---|
| Alejandre Kennia | -- | Lawyers Title Sd | |
| Alejandre Kennia | $356,000 | Title 365 | |
| Reig Asset Management Inc | $256,000 | Title 365 |
Source: Public Records
Mortgage History
| Date | Status | Borrower | Loan Amount |
|---|---|---|---|
| Open | Alejandre Kennia | $350,020 | |
| Previous Owner | Alejandre Kennia | $340,252 | |
| Previous Owner | Reig Asset Management Inc | $230,400 |
Source: Public Records
Tax History Compared to Growth
Tax History
| Year | Tax Paid | Tax Assessment Tax Assessment Total Assessment is a certain percentage of the fair market value that is determined by local assessors to be the total taxable value of land and additions on the property. | Land | Improvement |
|---|---|---|---|---|
| 2025 | $5,086 | $426,646 | $119,566 | $307,080 |
| 2024 | $5,086 | $418,281 | $117,222 | $301,059 |
| 2023 | $4,972 | $410,080 | $114,924 | $295,156 |
| 2022 | $4,838 | $402,040 | $112,671 | $289,369 |
| 2021 | $4,803 | $394,158 | $110,462 | $283,696 |
| 2020 | $4,745 | $390,118 | $109,330 | $280,788 |
| 2019 | $4,659 | $382,470 | $107,187 | $275,283 |
| 2018 | $4,355 | $374,972 | $105,086 | $269,886 |
| 2017 | $4,250 | $367,621 | $103,026 | $264,595 |
| 2016 | $4,196 | $360,413 | $101,006 | $259,407 |
| 2015 | $3,036 | $256,000 | $71,744 | $184,256 |
| 2014 | $550 | $51,033 | $14,302 | $36,731 |
Source: Public Records
Map
Nearby Homes
- 240 Ledgewood Ln
- 7449 Bullock Dr
- 124 Palawan Way
- 177 Coralwood Dr
- 763 Kingswood St
- 7263 Aquamarine Rd
- 7281 Danawoods Ct
- 7549 Goode St
- 7358 Gribble St
- 7853 Gribble St
- 1153 Manzana Way
- 7969 Royal Oak Place
- 111 69th St
- 2482 Manzana Way
- 425 S Meadowbrook Dr Unit 124
- 348 Sychar Rd
- 1403 Manzana Way
- 849 Plaza Cuernavaca Way
- 101 Coolwater Dr
- 8115 Cacus St
- 355 Northgate St
- 371 Northgate St
- 354 Kingswood St
- 344 Kingswood St
- 364 Kingswood St
- 347 Northgate St
- 377 Northgate St
- 364 Northgate St
- 356 Northgate St
- 334 Kingswood St
- 374 Kingswood St
- 372 Northgate St
- 348 Northgate St
- 327 Northgate St
- 383 Northgate St
- 380 Northgate St
- 340 Northgate St
- 326 Kingswood St
- 384 Kingswood St
- 317 Northgate St