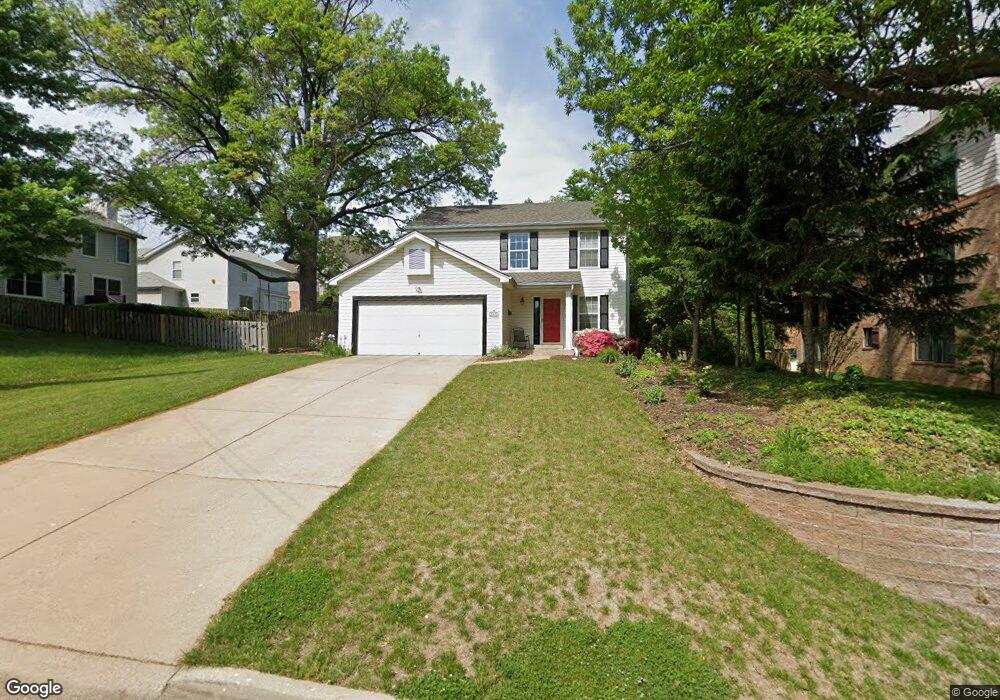
363 S Taylor Ave Saint Louis, MO 63122
Estimated Value: $410,000 - $516,000
3
Beds
3
Baths
1,344
Sq Ft
$358/Sq Ft
Est. Value
About This Home
This home is located at 363 S Taylor Ave, Saint Louis, MO 63122 and is currently estimated at $481,714, approximately $358 per square foot. 363 S Taylor Ave is a home located in St. Louis County with nearby schools including F.P. Tillman Elementary School, Nipher Middle School, and Kirkwood Senior High School.
Ownership History
Date
Name
Owned For
Owner Type
Purchase Details
Closed on
Aug 5, 2021
Sold by
Taylor Avenue Development Co Llc
Bought by
Moeller Craig
Current Estimated Value
Home Financials for this Owner
Home Financials are based on the most recent Mortgage that was taken out on this home.
Original Mortgage
$379,050
Outstanding Balance
$344,674
Interest Rate
2.9%
Mortgage Type
New Conventional
Estimated Equity
$137,040
Purchase Details
Closed on
Oct 25, 2002
Sold by
Waldrop Mark and Waldrop Dana
Bought by
Taylor Avenue Development Co Llc
Home Financials for this Owner
Home Financials are based on the most recent Mortgage that was taken out on this home.
Original Mortgage
$185,300
Interest Rate
6.01%
Purchase Details
Closed on
Dec 14, 2001
Sold by
Taylor Priscilla L
Bought by
Waldrop Mark and Waldrop Dana
Home Financials for this Owner
Home Financials are based on the most recent Mortgage that was taken out on this home.
Original Mortgage
$186,000
Interest Rate
5.75%
Create a Home Valuation Report for This Property
The Home Valuation Report is an in-depth analysis detailing your home's value as well as a comparison with similar homes in the area
Home Values in the Area
Average Home Value in this Area
Purchase History
| Date | Buyer | Sale Price | Title Company |
|---|---|---|---|
| Moeller Craig | $399,000 | Title Partners Agency Llc | |
| Taylor Avenue Development Co Llc | $218,000 | -- | |
| Waldrop Mark | $195,800 | -- |
Source: Public Records
Mortgage History
| Date | Status | Borrower | Loan Amount |
|---|---|---|---|
| Open | Moeller Craig | $379,050 | |
| Previous Owner | Taylor Avenue Development Co Llc | $185,300 | |
| Previous Owner | Waldrop Mark | $186,000 |
Source: Public Records
Tax History Compared to Growth
Tax History
| Year | Tax Paid | Tax Assessment Tax Assessment Total Assessment is a certain percentage of the fair market value that is determined by local assessors to be the total taxable value of land and additions on the property. | Land | Improvement |
|---|---|---|---|---|
| 2025 | $4,378 | $75,510 | $37,530 | $37,980 |
| 2024 | $4,378 | $69,730 | $24,020 | $45,710 |
| 2023 | $4,309 | $69,730 | $24,020 | $45,710 |
| 2022 | $4,114 | $57,380 | $19,550 | $37,830 |
| 2021 | $3,720 | $57,380 | $19,550 | $37,830 |
| 2020 | $3,373 | $49,990 | $19,550 | $30,440 |
| 2019 | $3,408 | $49,990 | $19,550 | $30,440 |
| 2018 | $3,405 | $44,120 | $16,280 | $27,840 |
| 2017 | $3,401 | $44,120 | $16,280 | $27,840 |
| 2016 | $2,456 | $32,010 | $12,690 | $19,320 |
| 2015 | $2,453 | $32,010 | $12,690 | $19,320 |
| 2014 | $2,506 | $32,010 | $14,990 | $17,020 |
Source: Public Records
Map
Nearby Homes
- 117 E Clinton Place Unit 7
- 132 E Monroe Ave Unit C-103
- 132 E Monroe Ave Unit 211
- 132 E Monroe Ave Unit E-106
- 132 E Monroe Ave Unit C-307
- 132 E Monroe Ave Unit 305
- 132 E Monroe Ave Unit 302
- 132 E Monroe Ave Unit 308
- 132 E Monroe Ave Unit 212
- 132 E Monroe Ave Unit A-102
- 132 E Monroe Ave Unit D-311
- 132 E Monroe Ave Unit 201
- 219 E Woodbine Ave
- 200 S Kirkwood Rd Unit 317
- 433 S Clay Ave
- 322 E Clinton Place
- 532 S Fillmore Ave
- 542 S Fillmore Ave
- 489 S Clay Ave
- 630 Candleberry Ct Unit D
- 129 E Clinton Place Unit 2B
- 129 E Clinton Place Unit 1D
- 129 E Clinton Place Unit 2D
- 129 E Clinton Place Unit 1C
- 129 E Clinton Place Unit 2C
- 129 E Clinton Place Unit 1A
- 129 E Clinton Place Unit 2A
- 129 E Clinton Place Unit 3D
- 129 E Clinton Place Unit 3A
- 129 E Clinton Place Unit 1B
- 129 E Clinton Place Unit 3C&D
- 143 E Clinton Place
- 139 E Clinton Place
- 125 E Clinton Place Unit 3B
- 125 E Clinton Place Unit 2B
- 125 E Clinton Place Unit 2D
- 125 E Clinton Place Unit 1D
- 125 E Clinton Place Unit 1C
- 125 E Clinton Place Unit 2A
- 125 E Clinton Place Unit 2C