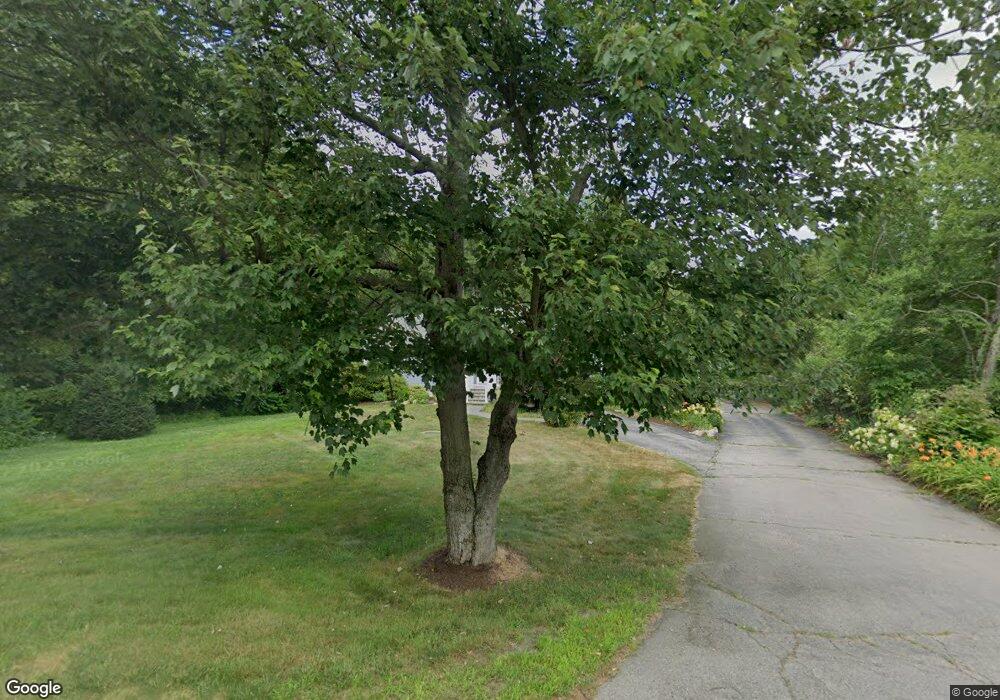
363 South St Foxboro, MA 02035
Estimated Value: $655,000 - $715,000
3
Beds
2
Baths
1,608
Sq Ft
$428/Sq Ft
Est. Value
About This Home
This home is located at 363 South St, Foxboro, MA 02035 and is currently estimated at $687,482, approximately $427 per square foot. 363 South St is a home located in Norfolk County with nearby schools including Foxborough High School, Foxborough Regional Charter School, and Hands-On-Montessori School.
Ownership History
Date
Name
Owned For
Owner Type
Purchase Details
Closed on
Jan 18, 1994
Sold by
Mckay Raymond E and Mckay Louissa W
Bought by
Mckay Cindy L
Current Estimated Value
Home Financials for this Owner
Home Financials are based on the most recent Mortgage that was taken out on this home.
Original Mortgage
$100,000
Interest Rate
7.22%
Mortgage Type
Purchase Money Mortgage
Purchase Details
Closed on
Sep 29, 1992
Sold by
Webber Wayne A
Bought by
Mckay Raymond E and Mckay Louisa M
Create a Home Valuation Report for This Property
The Home Valuation Report is an in-depth analysis detailing your home's value as well as a comparison with similar homes in the area
Home Values in the Area
Average Home Value in this Area
Purchase History
| Date | Buyer | Sale Price | Title Company |
|---|---|---|---|
| Mckay Cindy L | $130,000 | -- | |
| Mckay Raymond E | $150,000 | -- |
Source: Public Records
Mortgage History
| Date | Status | Borrower | Loan Amount |
|---|---|---|---|
| Open | Mckay Raymond E | $205,000 | |
| Closed | Mckay Raymond E | $115,000 | |
| Closed | Mckay Raymond E | $100,000 |
Source: Public Records
Tax History Compared to Growth
Tax History
| Year | Tax Paid | Tax Assessment Tax Assessment Total Assessment is a certain percentage of the fair market value that is determined by local assessors to be the total taxable value of land and additions on the property. | Land | Improvement |
|---|---|---|---|---|
| 2025 | $7,932 | $600,000 | $247,100 | $352,900 |
| 2024 | $7,578 | $560,900 | $264,400 | $296,500 |
| 2023 | $7,136 | $502,200 | $252,400 | $249,800 |
| 2022 | $6,697 | $461,200 | $227,500 | $233,700 |
| 2021 | $6,346 | $430,500 | $216,600 | $213,900 |
| 2020 | $6,047 | $415,000 | $216,600 | $198,400 |
| 2019 | $6,006 | $408,600 | $217,100 | $191,500 |
| 2018 | $5,703 | $391,400 | $206,800 | $184,600 |
| 2017 | $5,598 | $372,200 | $203,500 | $168,700 |
| 2016 | $5,406 | $364,800 | $196,400 | $168,400 |
| 2015 | $4,871 | $320,700 | $148,900 | $171,800 |
| 2014 | $4,857 | $324,000 | $148,900 | $175,100 |
Source: Public Records
Map
Nearby Homes
- 12 West St
- 80 Mill St
- 16 Bradner St
- 33 Treasure Island Rd
- 115 S High St
- 483 Thurston St
- 9 Oak Dr
- 24 Red Coat Ln
- 450 West St
- 356 Central St
- 8 Howard Ave
- 14 Baker St
- 56B Taunton St
- 11 W Belcher Rd Unit 5
- 4 Buckskin Dr
- 130 Washington St
- 126 Washington St
- 124 Washington St
- 84 Cocasset St Unit A6
- 160 Washington St Unit 44