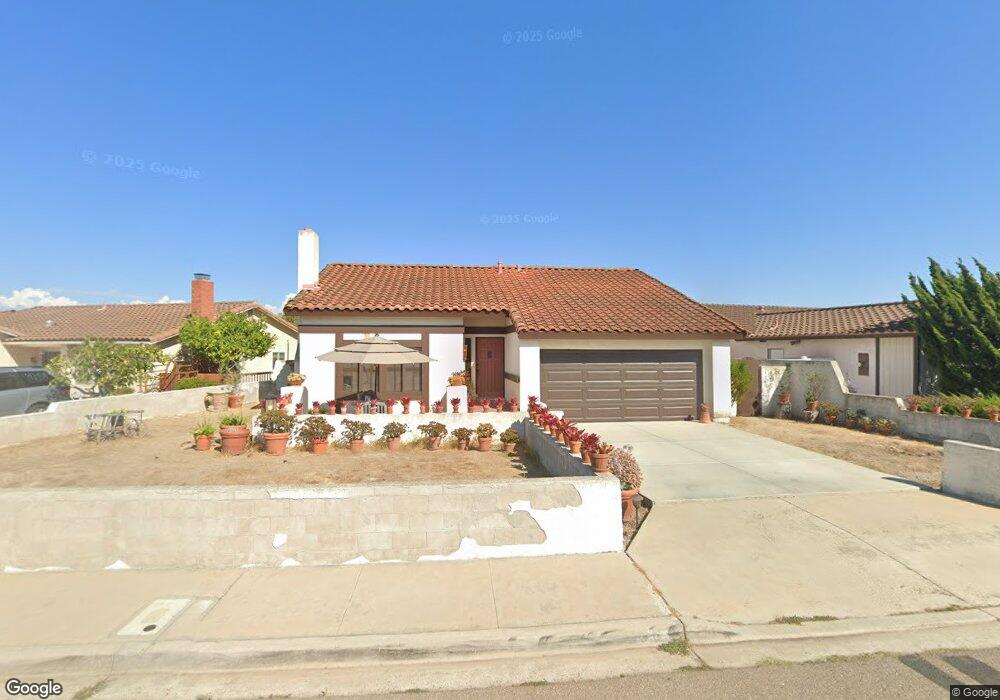
363 Trailview Rd Encinitas, CA 92024
Central Encinitas NeighborhoodEstimated Value: $1,723,257 - $2,541,000
3
Beds
2
Baths
1,980
Sq Ft
$1,042/Sq Ft
Est. Value
About This Home
This home is located at 363 Trailview Rd, Encinitas, CA 92024 and is currently estimated at $2,062,564, approximately $1,041 per square foot. 363 Trailview Rd is a home located in San Diego County with nearby schools including Park Dale Lane Elementary, Diegueno Middle School, and La Costa Canyon High School.
Ownership History
Date
Name
Owned For
Owner Type
Purchase Details
Closed on
May 9, 2019
Sold by
Lilly Walter A and Lilly Donna L
Bought by
Walter And Donna Lilly Revocable Trust
Current Estimated Value
Purchase Details
Closed on
Sep 24, 2004
Sold by
Lilly Donna L
Bought by
Lilly Walter A and Lilly Donna L
Purchase Details
Closed on
Jun 18, 2002
Sold by
Lily Walter A
Bought by
Lily Donna L
Home Financials for this Owner
Home Financials are based on the most recent Mortgage that was taken out on this home.
Original Mortgage
$360,250
Interest Rate
5.25%
Purchase Details
Closed on
Sep 18, 2000
Sold by
Lilly Donna L
Bought by
Lilly Walter A and Lilly Donna L
Purchase Details
Closed on
Mar 8, 2000
Sold by
Lilly Walter A
Bought by
Lilly Donna L
Home Financials for this Owner
Home Financials are based on the most recent Mortgage that was taken out on this home.
Original Mortgage
$292,500
Interest Rate
3.95%
Create a Home Valuation Report for This Property
The Home Valuation Report is an in-depth analysis detailing your home's value as well as a comparison with similar homes in the area
Home Values in the Area
Average Home Value in this Area
Purchase History
| Date | Buyer | Sale Price | Title Company |
|---|---|---|---|
| Walter And Donna Lilly Revocable Trust | -- | None Available | |
| Lilly Walter A | -- | -- | |
| Lily Donna L | -- | Fidelity National Title Co | |
| Lilly Walter A | -- | Fidelity National Title | |
| Lilly Donna L | -- | First American Title |
Source: Public Records
Mortgage History
| Date | Status | Borrower | Loan Amount |
|---|---|---|---|
| Closed | Lily Donna L | $360,250 | |
| Closed | Lilly Donna L | $292,500 |
Source: Public Records
Tax History
| Year | Tax Paid | Tax Assessment Tax Assessment Total Assessment is a certain percentage of the fair market value that is determined by local assessors to be the total taxable value of land and additions on the property. | Land | Improvement |
|---|---|---|---|---|
| 2025 | $1,734 | $110,138 | $24,454 | $85,684 |
| 2024 | $1,734 | $107,979 | $23,975 | $84,004 |
| 2023 | $1,646 | $105,862 | $23,505 | $82,357 |
| 2022 | $1,579 | $103,788 | $23,045 | $80,743 |
| 2021 | $1,525 | $101,754 | $22,594 | $79,160 |
| 2020 | $1,478 | $100,712 | $22,363 | $78,349 |
| 2019 | $1,454 | $98,738 | $21,925 | $76,813 |
| 2018 | $1,445 | $96,803 | $21,496 | $75,307 |
| 2017 | $1,424 | $94,906 | $21,075 | $73,831 |
| 2016 | $1,391 | $93,046 | $20,662 | $72,384 |
| 2015 | $1,345 | $91,649 | $20,352 | $71,297 |
| 2014 | $1,295 | $89,855 | $19,954 | $69,901 |
Source: Public Records
Map
Nearby Homes
- 2037 Countrywood Way
- 324 Countrywood Ln
- 905 Olive Crest Dr
- 516 Whisper Wind Dr
- 1830 Gatepost Rd
- 1824 Eastwood Ln
- 1986 Azure Way Unit 107
- 1971 Azure Way
- 1825 Hummock Ln
- 612 Lucylle Ln
- 804 & 814 Clark Ave
- 3736 38 Via Rancho Michelle
- 200 202 Neptune Ave
- 772 Conestoga Ct
- 250 258 Hillcrest Dr
- 824 Glen Arbor Dr
- 1733 Gentle Breeze Ln
- 1741 Charleston Ln
- 1709 Edgefield Ln
- 1990 Avenida la Posta
- 359 Trailview Rd
- 367 Trailview Rd
- 371 Trailview Rd
- 355 Trailview Rd
- 360 Trailview Rd
- 364 Trailview Rd
- 375 Trailview Rd
- 351 Trailview Rd
- 356 Trailview Rd
- 368 Trailview Rd
- 352 Trailview Rd
- 372 Trailview Rd
- 347 Trailview Rd
- 376 Trailview Rd
- 348 Trailview Rd
- 357 Willowspring Dr N
- 361 Willowspring Dr N
- 380 Trailview Rd
- 353 Willowspring Dr N
- 365 Willowspring Dr N
Your Personal Tour Guide
Ask me questions while you tour the home.