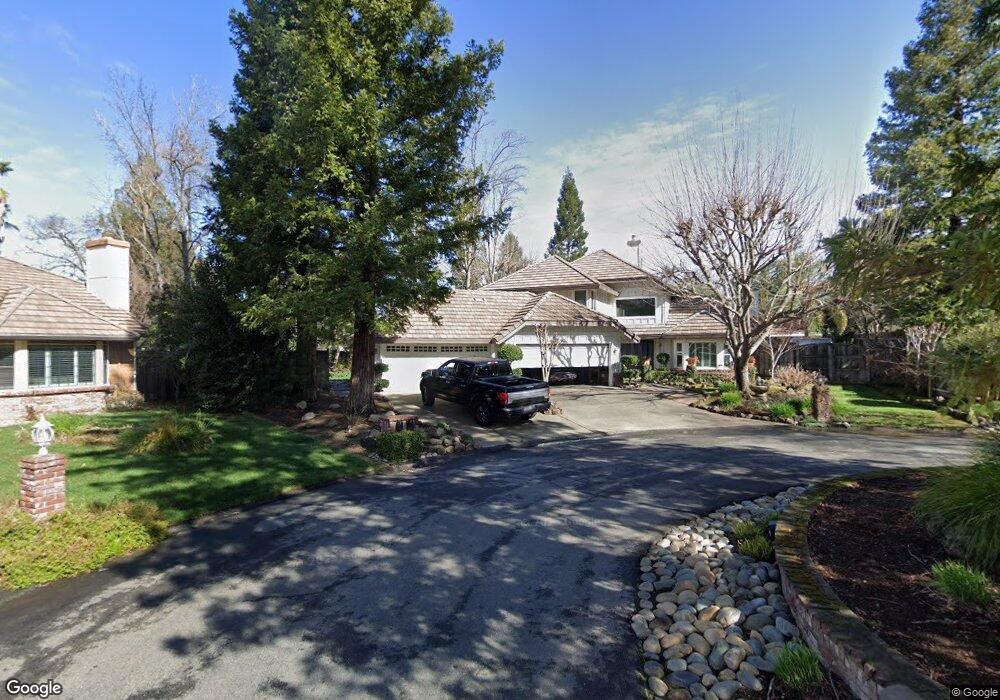
3630 Charring Ln Carmichael, CA 95608
Estimated Value: $999,000 - $1,190,000
5
Beds
4
Baths
3,038
Sq Ft
$366/Sq Ft
Est. Value
About This Home
This home is located at 3630 Charring Ln, Carmichael, CA 95608 and is currently estimated at $1,110,693, approximately $365 per square foot. 3630 Charring Ln is a home located in Sacramento County with nearby schools including Carmichael Elementary School, John Barrett Middle School, and Del Campo High School.
Ownership History
Date
Name
Owned For
Owner Type
Purchase Details
Closed on
Jun 8, 2000
Sold by
Warkus Barbara Joyce
Bought by
Plumer Michael Hart
Current Estimated Value
Home Financials for this Owner
Home Financials are based on the most recent Mortgage that was taken out on this home.
Original Mortgage
$252,700
Interest Rate
8.27%
Purchase Details
Closed on
Jun 7, 2000
Sold by
Plumer Michael Hart
Bought by
Hormell Fred W and Crawford Sandra L
Home Financials for this Owner
Home Financials are based on the most recent Mortgage that was taken out on this home.
Original Mortgage
$252,700
Interest Rate
8.27%
Purchase Details
Closed on
May 22, 1996
Sold by
Plumer Lauren B
Bought by
Plumer Michael Hart
Purchase Details
Closed on
Aug 10, 1995
Sold by
Palaca Loretta D
Bought by
Tune Kenneth S
Create a Home Valuation Report for This Property
The Home Valuation Report is an in-depth analysis detailing your home's value as well as a comparison with similar homes in the area
Home Values in the Area
Average Home Value in this Area
Purchase History
| Date | Buyer | Sale Price | Title Company |
|---|---|---|---|
| Plumer Michael Hart | -- | Financial Title Company | |
| Hormell Fred W | $485,000 | Financial Title Company | |
| Plumer Michael Hart | -- | Old Republic Title Company | |
| Plumer Michael Hart | $385,000 | Old Republic Title Company | |
| Tune Kenneth S | -- | Chicago Title Co |
Source: Public Records
Mortgage History
| Date | Status | Borrower | Loan Amount |
|---|---|---|---|
| Previous Owner | Hormell Fred W | $252,700 |
Source: Public Records
Tax History
| Year | Tax Paid | Tax Assessment Tax Assessment Total Assessment is a certain percentage of the fair market value that is determined by local assessors to be the total taxable value of land and additions on the property. | Land | Improvement |
|---|---|---|---|---|
| 2025 | $8,762 | $745,411 | $185,962 | $559,449 |
| 2024 | $8,762 | $730,796 | $182,316 | $548,480 |
| 2023 | $8,615 | $716,468 | $178,742 | $537,726 |
| 2022 | $8,441 | $702,421 | $175,238 | $527,183 |
| 2021 | $8,307 | $688,649 | $171,802 | $516,847 |
| 2020 | $8,151 | $681,589 | $170,041 | $511,548 |
| 2019 | $7,985 | $668,225 | $166,707 | $501,518 |
| 2018 | $7,883 | $655,124 | $163,439 | $491,685 |
| 2017 | $7,813 | $642,280 | $160,235 | $482,045 |
| 2016 | $7,297 | $629,688 | $157,094 | $472,594 |
| 2015 | $7,216 | $620,231 | $154,735 | $465,496 |
| 2014 | $7,065 | $608,082 | $151,704 | $456,378 |
Source: Public Records
Map
Nearby Homes
- 3403 Lindi Ct
- 3912 Bryan Way
- 4027 Porton Ln
- 4023 Porton Ln
- 4019 Porton Ln
- 4015 Porton Ln
- 4085 Porton Ln
- 4093 Porton Ln
- 8204 Caminata Ln
- 4097 Porton Ln
- 4072 Porton Ln
- 4076 Porton Ln
- 3997 Park Circle Ln Unit C
- 3901 Park Circle Ln Unit B
- 8217 Caminata Ln
- 8213 Caminata Ln
- 3928 Park Circle Ln Unit C
- 3900 Park Circle Ln Unit B
- 0 Landis Ave Unit 225145204
- 7204 Lynnbrook Ct
- 3629 Charring Ln
- 3620 Charring Ln
- 3625 Waynart Ct
- 3621 Waynart Ct
- 3629 Waynart Ct
- 3619 Charring Ln
- 3617 Waynart Ct
- 3633 Waynart Ct
- 3613 Waynart Ct
- 0 Duncan Ln
- 6740 Duncan Ln
- 3609 Waynart Ct
- 3701 Casa Loma Way
- 3610 Charring Ln
- 3632 Waynart Ct
- 6716 Duncan Ln
- 3620 Waynart Ct
- 3624 Waynart Ct
- 3616 Waynart Ct
- 3628 Waynart Ct