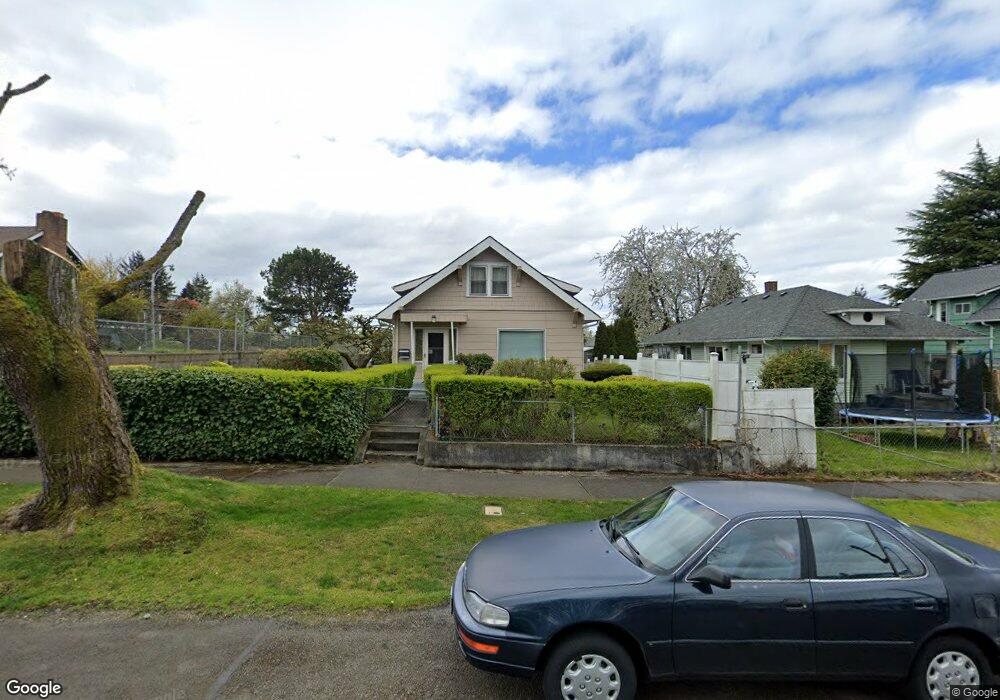
3630 E F St Tacoma, WA 98404
Eastside NeighborhoodEstimated Value: $422,000 - $448,454
2
Beds
1
Bath
1,420
Sq Ft
$309/Sq Ft
Est. Value
About This Home
This home is located at 3630 E F St, Tacoma, WA 98404 and is currently estimated at $438,114, approximately $308 per square foot. 3630 E F St is a home located in Pierce County with nearby schools including Blix Elementary School, Hunt Middle School, and Lincoln High School.
Ownership History
Date
Name
Owned For
Owner Type
Purchase Details
Closed on
Mar 16, 2005
Sold by
Montes Gonzalez Antonia
Bought by
Montes Gonzalez Luis R
Current Estimated Value
Home Financials for this Owner
Home Financials are based on the most recent Mortgage that was taken out on this home.
Original Mortgage
$100,000
Outstanding Balance
$50,428
Interest Rate
5.53%
Mortgage Type
Fannie Mae Freddie Mac
Estimated Equity
$387,686
Purchase Details
Closed on
Feb 24, 1998
Sold by
Dravis Bobby Roy
Bought by
Gonzalez Luis R Montes and Gonzalez Antonia Montes
Create a Home Valuation Report for This Property
The Home Valuation Report is an in-depth analysis detailing your home's value as well as a comparison with similar homes in the area
Home Values in the Area
Average Home Value in this Area
Purchase History
| Date | Buyer | Sale Price | Title Company |
|---|---|---|---|
| Montes Gonzalez Luis R | $100,000 | Ticor Title Escrow | |
| Gonzalez Luis R Montes | -- | Ticor |
Source: Public Records
Mortgage History
| Date | Status | Borrower | Loan Amount |
|---|---|---|---|
| Open | Montes Gonzalez Luis R | $100,000 |
Source: Public Records
Tax History Compared to Growth
Tax History
| Year | Tax Paid | Tax Assessment Tax Assessment Total Assessment is a certain percentage of the fair market value that is determined by local assessors to be the total taxable value of land and additions on the property. | Land | Improvement |
|---|---|---|---|---|
| 2025 | $4,265 | $412,900 | $190,300 | $222,600 |
| 2024 | $4,265 | $420,900 | $183,100 | $237,800 |
| 2023 | $4,265 | $382,900 | $170,500 | $212,400 |
| 2022 | $3,962 | $406,800 | $170,800 | $236,000 |
| 2021 | $3,660 | $291,000 | $106,700 | $184,300 |
| 2019 | $3,091 | $263,700 | $89,000 | $174,700 |
| 2018 | $3,193 | $237,700 | $71,200 | $166,500 |
| 2017 | $2,742 | $202,000 | $55,000 | $147,000 |
| 2016 | $2,427 | $146,300 | $41,000 | $105,300 |
| 2014 | $2,111 | $139,500 | $39,700 | $99,800 |
| 2013 | $2,111 | $123,200 | $34,800 | $88,400 |
Source: Public Records
Map
Nearby Homes