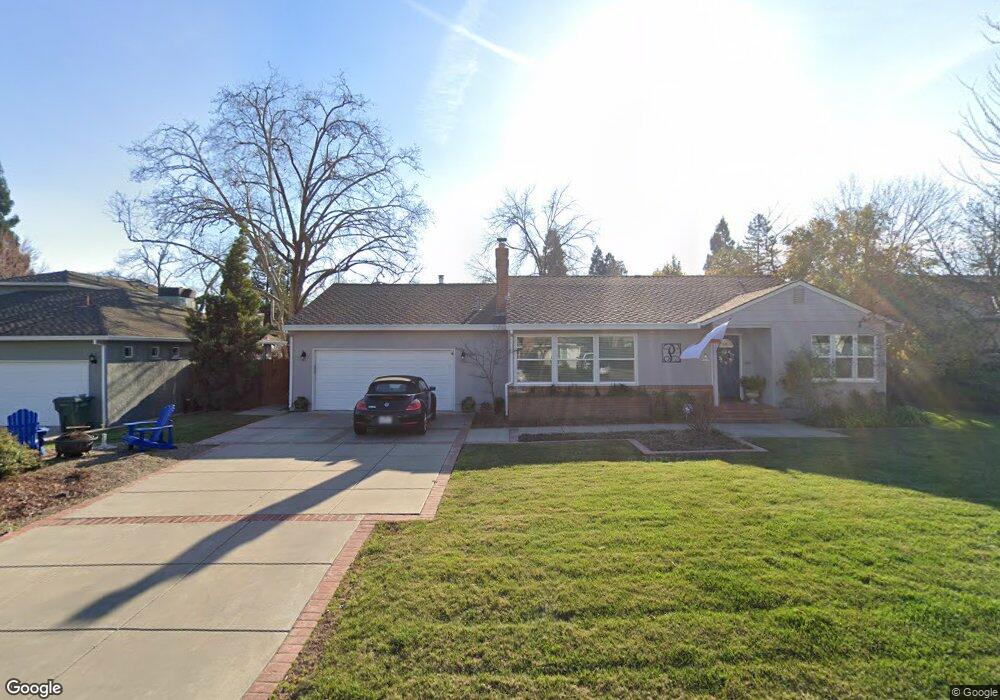
3630 Los Alamos Way Sacramento, CA 95864
Arden Park NeighborhoodEstimated Value: $822,000 - $1,311,000
4
Beds
2
Baths
2,949
Sq Ft
$390/Sq Ft
Est. Value
About This Home
This home is located at 3630 Los Alamos Way, Sacramento, CA 95864 and is currently estimated at $1,151,148, approximately $390 per square foot. 3630 Los Alamos Way is a home located in Sacramento County with nearby schools including Mariemont Elementary School, Arden Middle School, and Rio Americano High School.
Ownership History
Date
Name
Owned For
Owner Type
Purchase Details
Closed on
Jul 13, 2021
Sold by
Christopher Padilla Peter and Nelson Erica
Bought by
Padilla Family Trust
Current Estimated Value
Purchase Details
Closed on
Oct 1, 2020
Sold by
Padilla Peter C and Padilla Erica N
Bought by
Padilla Peter Christopher and Padilla Erica Nelson
Purchase Details
Closed on
Oct 25, 2011
Sold by
Mckibben Warburg Jason C and Mckibben Warburg Karen M
Bought by
Padilla Peter C and Padilla Erica N
Home Financials for this Owner
Home Financials are based on the most recent Mortgage that was taken out on this home.
Original Mortgage
$388,000
Interest Rate
3.95%
Mortgage Type
New Conventional
Purchase Details
Closed on
Feb 19, 2008
Sold by
Warburg Jason C and Warburg Karen M M
Bought by
Mckibben Warburg Jason C and Mckibben Warburg Karen M
Create a Home Valuation Report for This Property
The Home Valuation Report is an in-depth analysis detailing your home's value as well as a comparison with similar homes in the area
Home Values in the Area
Average Home Value in this Area
Purchase History
| Date | Buyer | Sale Price | Title Company |
|---|---|---|---|
| Padilla Family Trust | -- | Mortgage Connect | |
| Padilla Peter Christopher | -- | Mortgage Connect | |
| Padilla Peter Christopher | -- | None Available | |
| Padilla Peter C | $485,000 | Old Republic Title Company | |
| Mckibben Warburg Jason C | -- | None Available |
Source: Public Records
Mortgage History
| Date | Status | Borrower | Loan Amount |
|---|---|---|---|
| Previous Owner | Padilla Peter C | $388,000 |
Source: Public Records
Tax History Compared to Growth
Tax History
| Year | Tax Paid | Tax Assessment Tax Assessment Total Assessment is a certain percentage of the fair market value that is determined by local assessors to be the total taxable value of land and additions on the property. | Land | Improvement |
|---|---|---|---|---|
| 2025 | $7,873 | $660,281 | $376,811 | $283,470 |
| 2024 | $7,873 | $647,335 | $369,423 | $277,912 |
| 2023 | $7,675 | $634,643 | $362,180 | $272,463 |
| 2022 | $7,636 | $622,200 | $355,079 | $267,121 |
| 2021 | $7,426 | $610,001 | $348,117 | $261,884 |
| 2020 | $7,288 | $603,747 | $344,548 | $259,199 |
| 2019 | $7,141 | $591,910 | $337,793 | $254,117 |
| 2018 | $7,052 | $580,305 | $331,170 | $249,135 |
| 2017 | $6,988 | $568,927 | $324,677 | $244,250 |
| 2016 | $6,531 | $557,772 | $318,311 | $239,461 |
| 2015 | $6,420 | $549,395 | $313,530 | $235,865 |
| 2014 | $6,286 | $538,634 | $307,389 | $231,245 |
Source: Public Records
Map
Nearby Homes
- 3530 Bodega Ct
- 3601 San Ysidro Way
- 1 Usfs 8bn54 Rd
- 3710 Esperanza Dr
- 3511 La Habra Way
- 1448 El Tejon Way
- 1309 Shadowglen Rd
- 3304 Churchill Rd
- 3308 Hurley Way
- 3245 Wemberley Dr
- 3244 Windsor Dr
- 1345 Gladstone Dr
- 1340 Sebastian Way
- 1408 Sebastian Way
- 1429 Sebastian Way
- 3212 Hurley Way
- 800 Watt Ave
- 3125 Windsor Dr
- 740 Coronado Blvd
- 1153 Hampton Rd
- 3620 Los Alamos Way
- 3640 Los Alamos Way
- 3610 Los Alamos Way
- 3650 Los Alamos Way
- 3600 Los Alamos Way
- 3645 Buena Vista Dr
- 3660 Los Alamos Way
- 3554 Bodega Ct
- 3631 Los Alamos Way
- 3621 Los Alamos Way
- 3641 Los Alamos Way
- 3548 Bodega Ct
- 3641 Buena Vista Dr
- 3570 Los Alamos Way
- 3635 Buena Vista Dr
- 3611 Los Alamos Way
- 3560 Bodega Ct
- 3651 Los Alamos Way
- 3601 Los Alamos Way
- 3661 Los Alamos Way