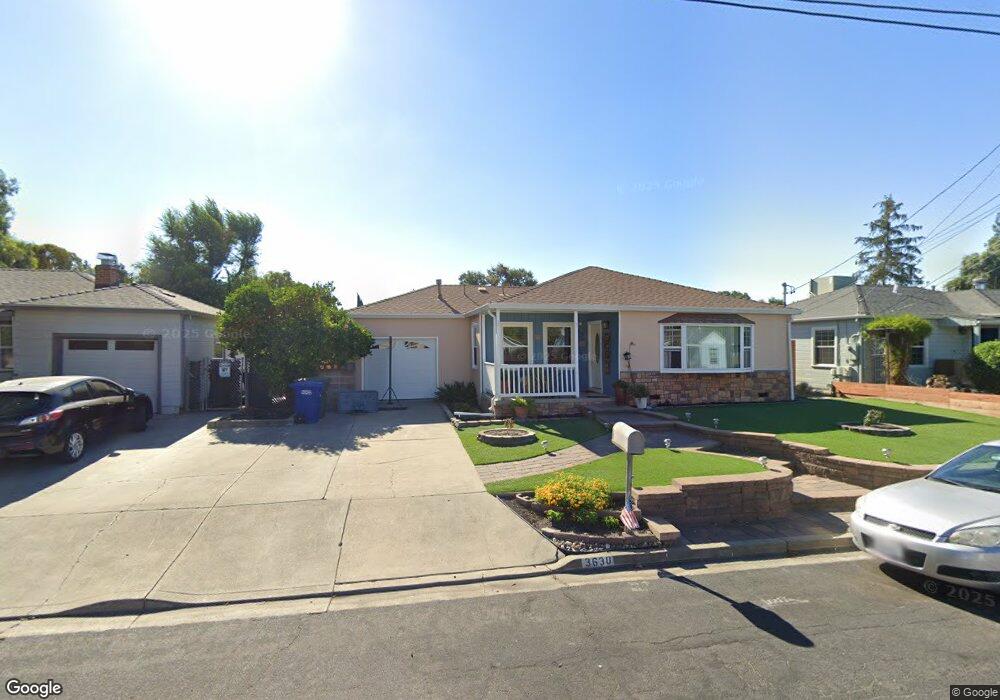
3630 Los Flores Ave Concord, CA 94519
Dana Estates NeighborhoodEstimated Value: $566,187 - $640,000
3
Beds
1
Bath
1,003
Sq Ft
$604/Sq Ft
Est. Value
About This Home
This home is located at 3630 Los Flores Ave, Concord, CA 94519 and is currently estimated at $606,047, approximately $604 per square foot. 3630 Los Flores Ave is a home located in Contra Costa County with nearby schools including Monte Gardens Elementary School, El Dorado Middle School, and Concord High School.
Ownership History
Date
Name
Owned For
Owner Type
Purchase Details
Closed on
Sep 4, 2018
Sold by
Cronin Elaine M and Cronin William J
Bought by
Cronin Elaine M and Cronin William J
Current Estimated Value
Purchase Details
Closed on
Aug 23, 1996
Sold by
Pringle James P
Bought by
Cronin Elaine M
Home Financials for this Owner
Home Financials are based on the most recent Mortgage that was taken out on this home.
Original Mortgage
$90,000
Outstanding Balance
$7,127
Interest Rate
8.23%
Mortgage Type
Purchase Money Mortgage
Estimated Equity
$598,920
Purchase Details
Closed on
Aug 13, 1996
Sold by
Cronin William J
Bought by
Cronin Elaine M
Home Financials for this Owner
Home Financials are based on the most recent Mortgage that was taken out on this home.
Original Mortgage
$90,000
Outstanding Balance
$7,127
Interest Rate
8.23%
Mortgage Type
Purchase Money Mortgage
Estimated Equity
$598,920
Purchase Details
Closed on
Oct 10, 1995
Sold by
Pringle James P
Bought by
Pringle James Philemon
Create a Home Valuation Report for This Property
The Home Valuation Report is an in-depth analysis detailing your home's value as well as a comparison with similar homes in the area
Home Values in the Area
Average Home Value in this Area
Purchase History
| Date | Buyer | Sale Price | Title Company |
|---|---|---|---|
| Cronin Elaine M | -- | None Available | |
| Cronin Elaine M | $120,000 | Old Republic Title Company | |
| Cronin Elaine M | -- | Old Republic Title Company | |
| Pringle James Philemon | -- | -- |
Source: Public Records
Mortgage History
| Date | Status | Borrower | Loan Amount |
|---|---|---|---|
| Open | Cronin Elaine M | $90,000 |
Source: Public Records
Tax History Compared to Growth
Tax History
| Year | Tax Paid | Tax Assessment Tax Assessment Total Assessment is a certain percentage of the fair market value that is determined by local assessors to be the total taxable value of land and additions on the property. | Land | Improvement |
|---|---|---|---|---|
| 2025 | $2,988 | $200,780 | $138,427 | $62,353 |
| 2024 | $2,909 | $196,844 | $135,713 | $61,131 |
| 2023 | $2,909 | $192,985 | $133,052 | $59,933 |
| 2022 | $2,925 | $189,202 | $130,444 | $58,758 |
| 2021 | $2,836 | $185,493 | $127,887 | $57,606 |
| 2019 | $2,768 | $179,994 | $124,095 | $55,899 |
| 2018 | $2,573 | $176,465 | $121,662 | $54,803 |
| 2017 | $2,483 | $168,104 | $119,277 | $48,827 |
| 2016 | $2,388 | $164,809 | $116,939 | $47,870 |
| 2015 | $2,331 | $162,334 | $115,183 | $47,151 |
| 2014 | $2,263 | $159,155 | $112,927 | $46,228 |
Source: Public Records
Map
Nearby Homes
- 3612 Los Flores Ave
- 3655 Granzotto Dr
- 1860 Granada Dr
- 3642 Lolita Dr
- 1867 Jacqueline Way
- 1824 Scott Rd
- 1820 Scott Rd
- 1828 Silverwood Dr
- 2040 Las Lomas Ct
- 1828 Clayton Way
- 1876 Lynwood Dr
- 3539 Wren Ave
- 3774 Larch Ct
- 3417 Wren Ave
- 3718 Northpark Ct
- 1832 Elkwood Dr
- 1930 N 6th St
- 3195 Willow Pass Rd
- 3166 Salvio St
- 1920 Encima Dr
- 3636 Los Flores Ave
- 3624 Los Flores Ave
- 3642 Los Flores Ave
- 3618 Los Flores Ave
- 3625 Granzotto Dr
- 3631 Granzotto Dr
- 1879 San Vincente Dr
- 3619 Granzotto Dr
- 3637 Granzotto Dr
- 3700 Los Flores Ave
- 3623 Los Flores Ave
- 3613 Granzotto Dr
- 3643 Granzotto Dr
- 1881 San Vincente Dr
- 3617 Los Flores Ave
- 3606 Los Flores Ave
- 3701 Los Flores Ave
- 3607 Granzotto Dr
- 3649 Granzotto Dr
- 3611 Los Flores Ave