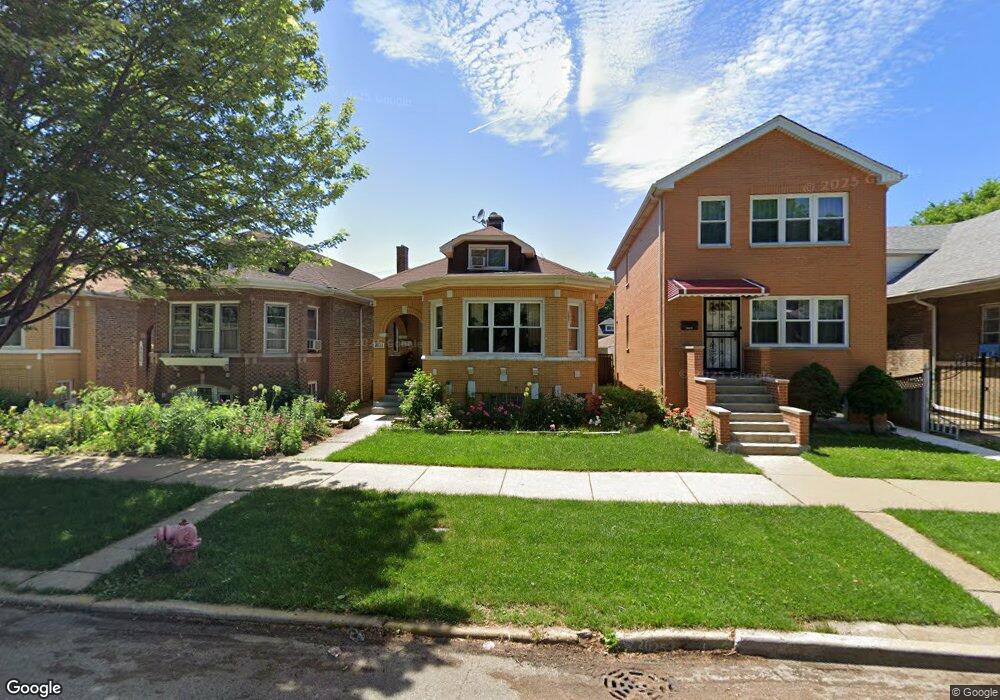
3630 N Mozart St Chicago, IL 60618
Irving Park NeighborhoodEstimated Value: $393,000 - $870,000
3
Beds
2
Baths
1,178
Sq Ft
$528/Sq Ft
Est. Value
About This Home
This home is located at 3630 N Mozart St, Chicago, IL 60618 and is currently estimated at $622,091, approximately $528 per square foot. 3630 N Mozart St is a home located in Cook County with nearby schools including Cleveland Elementary School, Schurz High School, and Acero Charter - Carlos Fuentes Cmpus.
Ownership History
Date
Name
Owned For
Owner Type
Purchase Details
Closed on
Mar 4, 2024
Sold by
Joligon Melinda B
Bought by
Joligon Melinda B and Grewal Mandeep J
Current Estimated Value
Home Financials for this Owner
Home Financials are based on the most recent Mortgage that was taken out on this home.
Original Mortgage
$417,000
Outstanding Balance
$410,064
Interest Rate
6.63%
Mortgage Type
New Conventional
Estimated Equity
$212,027
Purchase Details
Closed on
Aug 31, 2000
Sold by
Hrbek Loren C
Bought by
Joligon Melinda B
Home Financials for this Owner
Home Financials are based on the most recent Mortgage that was taken out on this home.
Original Mortgage
$202,350
Interest Rate
8.03%
Purchase Details
Closed on
Oct 18, 1995
Sold by
Macaso Napoleon and Macaso Myrna
Bought by
Mauricio Violeta D
Home Financials for this Owner
Home Financials are based on the most recent Mortgage that was taken out on this home.
Original Mortgage
$140,600
Interest Rate
7.68%
Create a Home Valuation Report for This Property
The Home Valuation Report is an in-depth analysis detailing your home's value as well as a comparison with similar homes in the area
Home Values in the Area
Average Home Value in this Area
Purchase History
| Date | Buyer | Sale Price | Title Company |
|---|---|---|---|
| Joligon Melinda B | -- | Citywide Title | |
| Joligon Melinda B | $213,000 | -- | |
| Mauricio Violeta D | $148,000 | -- |
Source: Public Records
Mortgage History
| Date | Status | Borrower | Loan Amount |
|---|---|---|---|
| Open | Joligon Melinda B | $417,000 | |
| Previous Owner | Joligon Melinda B | $202,350 | |
| Previous Owner | Mauricio Violeta D | $140,600 |
Source: Public Records
Tax History Compared to Growth
Tax History
| Year | Tax Paid | Tax Assessment Tax Assessment Total Assessment is a certain percentage of the fair market value that is determined by local assessors to be the total taxable value of land and additions on the property. | Land | Improvement |
|---|---|---|---|---|
| 2024 | $8,690 | $43,085 | $23,250 | $19,835 |
| 2023 | $8,433 | $47,011 | $18,754 | $28,257 |
| 2022 | $8,433 | $47,011 | $18,754 | $28,257 |
| 2021 | $8,912 | $50,170 | $18,753 | $31,417 |
| 2020 | $4,720 | $26,699 | $8,250 | $18,449 |
| 2019 | $7,324 | $42,505 | $8,250 | $34,255 |
| 2018 | $7,198 | $42,505 | $8,250 | $34,255 |
| 2017 | $5,213 | $30,212 | $7,500 | $22,712 |
| 2016 | $5,211 | $30,212 | $7,500 | $22,712 |
| 2015 | $5,556 | $30,212 | $7,500 | $22,712 |
| 2014 | $5,465 | $29,349 | $6,750 | $22,599 |
| 2013 | $4,535 | $29,349 | $6,750 | $22,599 |
Source: Public Records
Map
Nearby Homes
- 3634 N Mozart St
- 2844 W Addison St Unit P1
- 3621 N Richmond St
- 3725 N Richmond St
- 3716 N Richmond St
- 3748 N Sacramento Ave
- 3523 N Whipple St
- 3507 N Whipple St
- 3836 N Richmond St Unit 1N
- 3100 N Albany Ave
- 3908 N Mozart St
- 3929 N Francisco Ave
- 3314 N California Ave
- 3748 N Troy St
- 3312 N California Ave
- 3801 N Kedzie Ave Unit 1S
- 3342 N Whipple St
- 3815 N Kedzie Ave Unit 3S
- 2714 W Byron St
- 3024 W Irving Park Rd Unit 1S
- 3626 N Mozart St
- 3636 N Mozart St
- 3624 N Mozart St
- 3620 N Mozart St
- 3638 N Mozart St
- 3618 N Mozart St
- 3642 N Mozart St
- 3631 N Francisco Ave
- 3627 N Francisco Ave
- 3635 N Francisco Ave
- 3644 N Mozart St
- 3614 N Mozart St
- 3625 N Francisco Ave
- 3637 N Francisco Ave
- 3621 N Francisco Ave
- 3639 N Francisco Ave
- 3648 N Mozart St
- 3619 N Francisco Ave
- 3641 N Francisco Ave
- 3631 N Mozart St