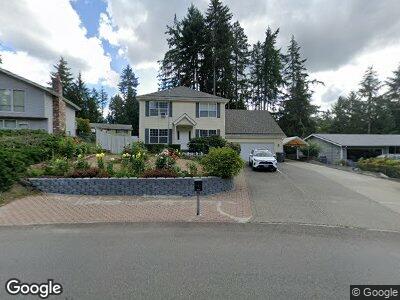
3630 SE Buckingham Dr Port Orchard, WA 98366
Parkwood NeighborhoodEstimated Value: $490,000 - $533,000
3
Beds
3
Baths
1,944
Sq Ft
$265/Sq Ft
Est. Value
About This Home
This home is located at 3630 SE Buckingham Dr, Port Orchard, WA 98366 and is currently estimated at $515,780, approximately $265 per square foot. 3630 SE Buckingham Dr is a home located in Kitsap County with nearby schools including Orchard Heights Elementary School, Marcus Whitman Middle School, and South Kitsap High School.
Ownership History
Date
Name
Owned For
Owner Type
Purchase Details
Closed on
Jul 7, 2004
Sold by
Temple Michael Du
Bought by
Cruz Aurelio C and Cruz Juliet F
Current Estimated Value
Home Financials for this Owner
Home Financials are based on the most recent Mortgage that was taken out on this home.
Original Mortgage
$222,043
Interest Rate
6.31%
Mortgage Type
VA
Purchase Details
Closed on
Jul 15, 2002
Sold by
Pioneer Builders Inc
Bought by
Dutemple Michael
Home Financials for this Owner
Home Financials are based on the most recent Mortgage that was taken out on this home.
Original Mortgage
$170,952
Interest Rate
6.69%
Purchase Details
Closed on
Mar 27, 2000
Sold by
Fessler Mildred A
Bought by
Pioneer Builders Inc
Create a Home Valuation Report for This Property
The Home Valuation Report is an in-depth analysis detailing your home's value as well as a comparison with similar homes in the area
Home Values in the Area
Average Home Value in this Area
Purchase History
| Date | Buyer | Sale Price | Title Company |
|---|---|---|---|
| Cruz Aurelio C | $214,950 | Stewart Title Of Kitsap | |
| Dutemple Michael | $179,950 | Land Title Company | |
| Pioneer Builders Inc | $26,000 | Land Title Company |
Source: Public Records
Mortgage History
| Date | Status | Borrower | Loan Amount |
|---|---|---|---|
| Open | Cruz Aurelio C | $50,000 | |
| Open | Cruz Aurelio C | $317,294 | |
| Closed | Cruz Aurelio C | $282,575 | |
| Closed | Cruz Aurelio C | $293,335 | |
| Closed | Cruz Aurelio C | $54,800 | |
| Closed | Cruz Aurelio C | $222,043 | |
| Previous Owner | Dutemple Michael | $170,952 |
Source: Public Records
Tax History Compared to Growth
Tax History
| Year | Tax Paid | Tax Assessment Tax Assessment Total Assessment is a certain percentage of the fair market value that is determined by local assessors to be the total taxable value of land and additions on the property. | Land | Improvement |
|---|---|---|---|---|
| 2025 | $4,152 | $472,920 | $62,350 | $410,570 |
| 2024 | $4,026 | $472,920 | $62,350 | $410,570 |
| 2023 | $3,999 | $472,920 | $62,350 | $410,570 |
| 2022 | $3,916 | $387,960 | $58,230 | $329,730 |
| 2021 | $3,593 | $336,330 | $54,110 | $282,220 |
| 2020 | $3,524 | $320,490 | $51,530 | $268,960 |
| 2019 | $2,964 | $295,340 | $50,590 | $244,750 |
| 2018 | $3,083 | $236,850 | $50,590 | $186,260 |
| 2017 | $2,622 | $236,850 | $50,590 | $186,260 |
| 2016 | $2,550 | $210,680 | $50,590 | $160,090 |
| 2015 | $2,462 | $206,060 | $50,590 | $155,470 |
| 2014 | -- | $202,980 | $50,590 | $152,390 |
| 2013 | -- | $210,320 | $53,250 | $157,070 |
Source: Public Records
Map
Nearby Homes
- 3487 Balsam Blvd SE
- 3512 Balsam Blvd SE
- 3620 Westminster Dr SE
- 2893 Maple Crest Ln SE
- 3105 SE Summer Place
- 3135 Rustlewood Ln SE
- 2541 Red Spruce Dr SE
- 2453 Parkwood Dr SE
- 2457 White Cedar Dr SE
- 2523 Jackson Ave SE
- 3965 Celeste Ct SE
- 3299 Madrona Dr SE
- 2810 SE Arie Ct
- 2948 SE Alson Ct
- 4489 Aiken Rd SE
- 5224 Del Tormey Place SE
- 2850 SE Salmonberry Rd
- 1978 Kelowna Place Southest
- 3100 SE Travera Dr
- 2240 Ponderosa Dr SE
- 3630 SE Buckingham Dr
- 3644 SE Buckingham Dr
- 3695 Yorkshire Dr SE
- 3725 Yorkshire Dr SE
- 3658 SE Buckingham Dr
- 3675 Yorkshire Dr SE
- 3637 SE Buckingham Dr
- 3735 Yorkshire Dr SE
- 3657 SE Buckingham Dr
- 3672 SE Buckingham Dr
- 3645 Yorkshire Dr SE
- 3745 Yorkshire Dr SE
- 3625 Yorkshire Dr SE
- 3730 Yorkshire Dr SE
- 3680 Yorkshire Dr SE
- 3686 SE Buckingham Dr
- 3683 SE Ardenwald Place
- 3755 Yorkshire Dr SE
- 3679 SE Buckingham Dr
- 3660 Yorkshire Dr SE