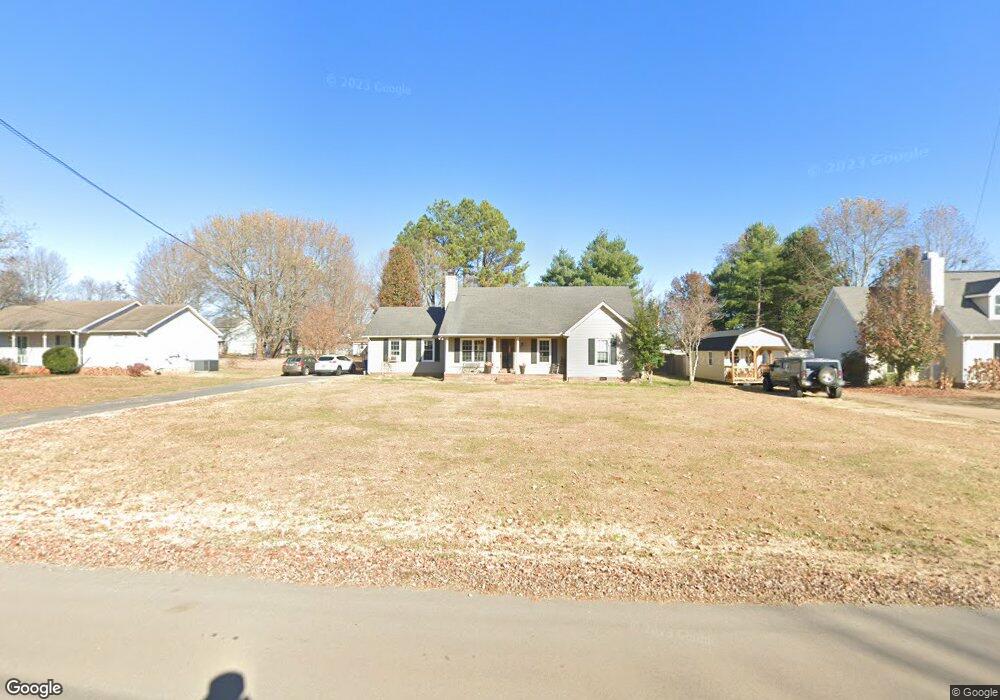
3630 Sugarbush Ct Murfreesboro, TN 37127
Estimated Value: $332,689 - $403,000
--
Bed
2
Baths
1,372
Sq Ft
$264/Sq Ft
Est. Value
About This Home
This home is located at 3630 Sugarbush Ct, Murfreesboro, TN 37127 and is currently estimated at $361,672, approximately $263 per square foot. 3630 Sugarbush Ct is a home located in Rutherford County with nearby schools including Buchanan Elementary School, Whitworth-Buchanan Middle School, and Riverdale High School.
Ownership History
Date
Name
Owned For
Owner Type
Purchase Details
Closed on
Mar 23, 2006
Sold by
Rodgers Paula D
Bought by
Shelea Fox
Current Estimated Value
Home Financials for this Owner
Home Financials are based on the most recent Mortgage that was taken out on this home.
Original Mortgage
$128,679
Outstanding Balance
$72,982
Interest Rate
6.23%
Mortgage Type
Purchase Money Mortgage
Estimated Equity
$288,690
Purchase Details
Closed on
Sep 28, 2001
Sold by
Jackson Paula D and Jackson Jamie T
Bought by
Rodgers Paula D and Rodgers Jamie T
Home Financials for this Owner
Home Financials are based on the most recent Mortgage that was taken out on this home.
Original Mortgage
$109,900
Interest Rate
6.87%
Purchase Details
Closed on
Dec 13, 1999
Sold by
King Tracy S
Bought by
Jackson Ralph A and Jackson Kim D
Create a Home Valuation Report for This Property
The Home Valuation Report is an in-depth analysis detailing your home's value as well as a comparison with similar homes in the area
Home Values in the Area
Average Home Value in this Area
Purchase History
| Date | Buyer | Sale Price | Title Company |
|---|---|---|---|
| Shelea Fox | $129,900 | -- | |
| Rodgers Paula D | $109,900 | -- | |
| Jackson Ralph A | $103,500 | -- |
Source: Public Records
Mortgage History
| Date | Status | Borrower | Loan Amount |
|---|---|---|---|
| Open | Jackson Ralph A | $128,679 | |
| Previous Owner | Jackson Ralph A | $109,900 |
Source: Public Records
Tax History Compared to Growth
Tax History
| Year | Tax Paid | Tax Assessment Tax Assessment Total Assessment is a certain percentage of the fair market value that is determined by local assessors to be the total taxable value of land and additions on the property. | Land | Improvement |
|---|---|---|---|---|
| 2025 | $1,387 | $73,950 | $13,750 | $60,200 |
| 2024 | $1,387 | $73,950 | $13,750 | $60,200 |
| 2023 | $1,387 | $73,950 | $13,750 | $60,200 |
| 2022 | $1,181 | $73,100 | $13,750 | $59,350 |
| 2021 | $1,120 | $50,450 | $8,125 | $42,325 |
| 2020 | $1,120 | $50,450 | $8,125 | $42,325 |
| 2019 | $1,120 | $50,450 | $8,125 | $42,325 |
| 2018 | $1,059 | $50,450 | $0 | $0 |
| 2017 | $854 | $31,875 | $0 | $0 |
| 2016 | $854 | $31,875 | $0 | $0 |
| 2015 | $854 | $31,875 | $0 | $0 |
| 2014 | $793 | $31,875 | $0 | $0 |
| 2013 | -- | $29,475 | $0 | $0 |
Source: Public Records
Map
Nearby Homes
- 3647 Sugarbush Ct
- 2410 Lightbend Dr
- 4203 Sarazen Ln
- 4218 Golden Sun Ct
- 1324 Sunray Dr
- 1847 Streamsong Dr
- 1845 Streamsong Dr
- 1843 Streamsong Dr
- 1840 Streamsong Dr
- 4316 Doral Dr
- 4325 Calusa Dr
- 4327 Calusa Dr
- 4329 Calusa Dr
- 4262 Golden Sun Ct
- 4331 Calusa Dr
- 4335 Calusa Dr
- 4337 Calusa Dr
- 4339 Calusa Dr
- 4349 Doral Dr
- 4349 Spyglass Dr
- 3636 Sugarbush Ct
- 3624 Sugarbush Ct
- 3623 Dilton Mankin Rd
- 3631 Dilton Mankin Rd
- 3642 Sugarbush Ct
- 3616 Sugarbush Ct
- 3635 Sugarbush Ct
- 3625 Sugarbush Ct
- 3617 Dilton Mankin Rd
- 3639 Dilton Mankin Rd
- 3619 Sugarbush Ct
- 3641 Sugarbush Ct
- 3650 Sugarbush Ct
- 3611 Dilton Mankin Rd
- 3645 Dilton Mankin Rd
- 3612 Sugarbush Ct
- 3615 Sugarbush Ct
- 3651 Dilton Mankin Rd
- 3603 Dilton Mankin Rd
- 3651 Sugarbush Ct