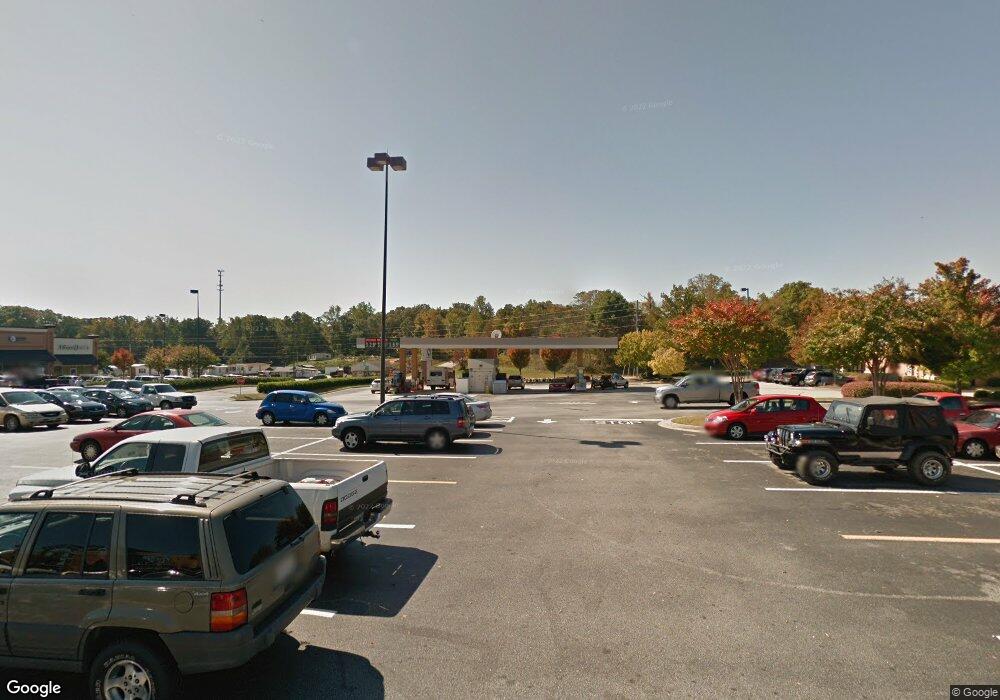
3630 Thompson Bridge Rd Gainesville, GA 30506
Estimated Value: $40,065,668
--
Bed
--
Bath
1,450
Sq Ft
$27,631/Sq Ft
Est. Value
About This Home
This home is located at 3630 Thompson Bridge Rd, Gainesville, GA 30506 and is currently estimated at $40,065,668, approximately $27,631 per square foot. 3630 Thompson Bridge Rd is a home located in Hall County with nearby schools including Elbert Elementary School, Mount Vernon Elementary School, and North Hall Middle School.
Ownership History
Date
Name
Owned For
Owner Type
Purchase Details
Closed on
Aug 8, 2016
Sold by
Hr Thompson Bridge Llc
Bought by
New Market Thompson Bridge Llc
Current Estimated Value
Home Financials for this Owner
Home Financials are based on the most recent Mortgage that was taken out on this home.
Original Mortgage
$12,700,000
Outstanding Balance
$1,314,179
Interest Rate
2.74%
Estimated Equity
$38,751,489
Purchase Details
Closed on
Mar 12, 2009
Sold by
Wri Thompson Bridge Llc
Bought by
Wri Hr Thompson Bridge Llc
Home Financials for this Owner
Home Financials are based on the most recent Mortgage that was taken out on this home.
Original Mortgage
$6,479,562
Interest Rate
5.13%
Mortgage Type
Commercial
Purchase Details
Closed on
Apr 26, 2005
Sold by
Thompson Bridge Commons Llc
Bought by
Wri Thompson Bridge Llc
Purchase Details
Closed on
Apr 27, 2000
Sold by
Capital First Group Inc
Bought by
Thompson Bridge Commons Llc
Purchase Details
Closed on
Dec 2, 1996
Bought by
Capital First Group Inc
Create a Home Valuation Report for This Property
The Home Valuation Report is an in-depth analysis detailing your home's value as well as a comparison with similar homes in the area
Home Values in the Area
Average Home Value in this Area
Purchase History
| Date | Buyer | Sale Price | Title Company |
|---|---|---|---|
| New Market Thompson Bridge Llc | $19,320,000 | -- | |
| Wri Hr Thompson Bridge Llc | $15,285,000 | -- | |
| Wri Thompson Bridge Llc | $12,750,000 | -- | |
| Thompson Bridge Commons Llc | -- | -- | |
| Capital First Group Inc | $200,000 | -- |
Source: Public Records
Mortgage History
| Date | Status | Borrower | Loan Amount |
|---|---|---|---|
| Open | New Market Thompson Bridge Llc | $12,700,000 | |
| Previous Owner | Wri Hr Thompson Bridge Llc | $6,479,562 |
Source: Public Records
Tax History Compared to Growth
Tax History
| Year | Tax Paid | Tax Assessment Tax Assessment Total Assessment is a certain percentage of the fair market value that is determined by local assessors to be the total taxable value of land and additions on the property. | Land | Improvement |
|---|---|---|---|---|
| 2024 | $131,326 | $5,323,320 | $883,930 | $4,439,390 |
| 2023 | $136,921 | $5,323,320 | $883,930 | $4,439,390 |
| 2022 | $136,921 | $3,944,440 | $760,680 | $3,183,760 |
| 2021 | $113,323 | $4,001,400 | $760,680 | $3,240,720 |
| 2020 | $137,299 | $5,086,480 | $832,186 | $4,254,294 |
| 2019 | $138,545 | $5,086,480 | $832,186 | $4,254,294 |
| 2018 | $109,071 | $3,874,640 | $633,920 | $3,240,720 |
| 2017 | $105,332 | $3,874,640 | $633,920 | $3,240,720 |
Source: Public Records
Map
Nearby Homes
- 3712 Corinth Dr
- 3649 Garden Blvd
- 3675 Rosedale Cir
- 3911 Fraser Cir
- 3557 Meadow Ln
- 3727 Francis Trail
- 3740 Woodlane Rd
- Cole Plan at Somerset at Riverbrook
- York Plan at Somerset at Riverbrook
- Cheyenne Plan at Somerset at Riverbrook
- 3831 Brookburn Park
- 3903 Walnut Grove Way
- 3853 Alexandria Dr
- 3804 Price Rd
- 3933 Walnut Grove Way Unit 9999
- 4076 Fairmont St
- 4136 Riverbrook Terrace
- 4140 Riverbrook Terrace
- 3631 Mount Vernon Rd Unit SUITE 101
- 3631 Mount Vernon Rd Unit 101 & 201
- 3631 Mount Vernon Suite 101 Rd
- 3631 Mount Vernon Rd
- 3606 Thompson Bridge Rd
- 3624 Mount Vernon Rd
- 3632 Mount Vernon Rd
- 3654 Thompson Bridge Rd
- 3663 Mount Vernon Rd
- 3650 Mount Vernon Rd
- 3716 Indian Springs Rd
- 3642 Mount Vernon Rd
- 3681 Mount Vernon Rd
- 3720 Indian Springs Rd
- 3578 Thompson Bridge Rd Unit 1041
- 3704 Corinth Dr Unit 3704
- 3704 Corinth Dr
- 3646 Mount Vernon Rd
- 3524 Southers Rd
- 3524 Southers Rd