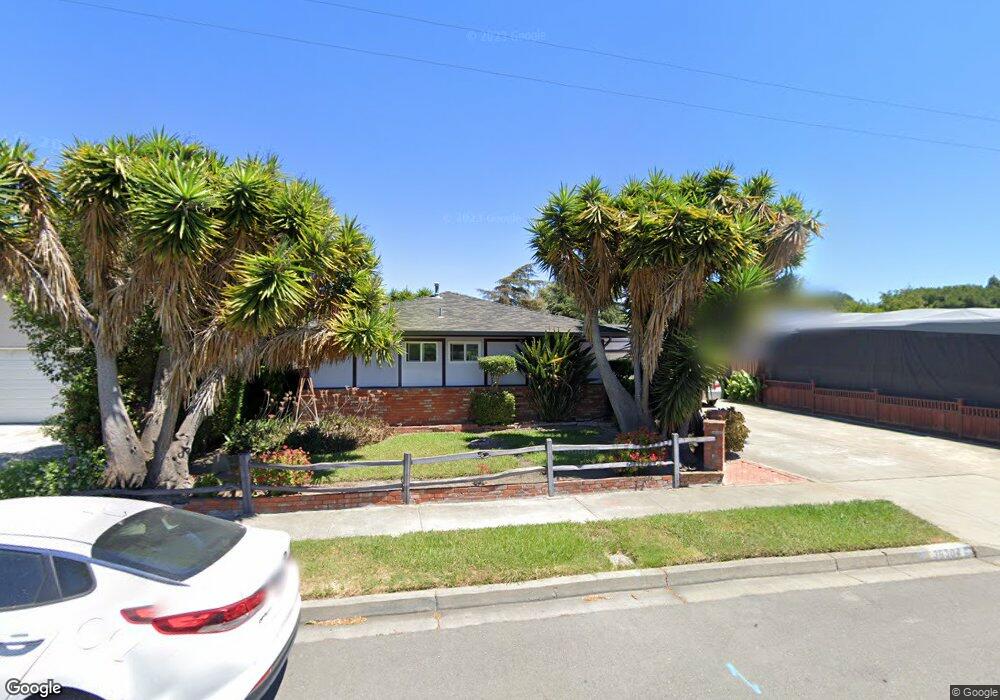
36304 Indian Wells Dr Newark, CA 94560
Estimated Value: $1,213,000 - $1,449,000
4
Beds
2
Baths
1,258
Sq Ft
$1,053/Sq Ft
Est. Value
About This Home
This home is located at 36304 Indian Wells Dr, Newark, CA 94560 and is currently estimated at $1,325,120, approximately $1,053 per square foot. 36304 Indian Wells Dr is a home located in Alameda County with nearby schools including Lincoln Elementary School, Newark Junior High School, and Newark Memorial High School.
Ownership History
Date
Name
Owned For
Owner Type
Purchase Details
Closed on
Oct 17, 2014
Sold by
Gore Jason and Gore Tao
Bought by
Gore Jason and The Gore Family Living Trust
Current Estimated Value
Purchase Details
Closed on
Jan 10, 2013
Sold by
Garcia Frank Estrada and Gamez Gina
Bought by
Gore Jason and Gore Tao
Purchase Details
Closed on
Feb 28, 2008
Sold by
Gamez Martiniano J and Gamez Gina
Bought by
Garcia Frank E
Purchase Details
Closed on
May 31, 2007
Sold by
Garcia Frank E
Bought by
Garcia Frank E and Gamez Martiniano J
Home Financials for this Owner
Home Financials are based on the most recent Mortgage that was taken out on this home.
Original Mortgage
$127,000
Interest Rate
6.5%
Mortgage Type
Purchase Money Mortgage
Create a Home Valuation Report for This Property
The Home Valuation Report is an in-depth analysis detailing your home's value as well as a comparison with similar homes in the area
Home Values in the Area
Average Home Value in this Area
Purchase History
| Date | Buyer | Sale Price | Title Company |
|---|---|---|---|
| Gore Jason | -- | None Available | |
| Gore Jason | $400,000 | Chicago Title Company | |
| Garcia Frank E | -- | Lenders Choice Title Company | |
| Garcia Frank E | $76,909 | Ticor Title Co Of California |
Source: Public Records
Mortgage History
| Date | Status | Borrower | Loan Amount |
|---|---|---|---|
| Previous Owner | Garcia Frank E | $127,000 |
Source: Public Records
Tax History Compared to Growth
Tax History
| Year | Tax Paid | Tax Assessment Tax Assessment Total Assessment is a certain percentage of the fair market value that is determined by local assessors to be the total taxable value of land and additions on the property. | Land | Improvement |
|---|---|---|---|---|
| 2025 | $7,399 | $587,368 | $147,765 | $439,603 |
| 2024 | $7,399 | $575,853 | $144,868 | $430,985 |
| 2023 | $7,196 | $564,563 | $142,028 | $422,535 |
| 2022 | $7,100 | $553,497 | $139,244 | $414,253 |
| 2021 | $6,925 | $542,645 | $136,514 | $406,131 |
| 2020 | $6,819 | $537,083 | $135,115 | $401,968 |
| 2019 | $6,723 | $526,555 | $132,466 | $394,089 |
| 2018 | $5,924 | $456,900 | $129,870 | $327,030 |
| 2017 | $5,498 | $424,411 | $127,323 | $297,088 |
| 2016 | $5,437 | $416,091 | $124,827 | $291,264 |
| 2015 | $5,419 | $409,843 | $122,953 | $286,890 |
| 2014 | $5,271 | $401,815 | $120,544 | $281,271 |
Source: Public Records
Map
Nearby Homes
- 36184 Toulouse St
- 7574 Birkdale Dr
- 36466 Haley St
- 35914 Burning Tree Dr
- 6831 Cabernet Ave
- 36563 Beutke Dr
- 36535 Mulberry St
- 6875 Normandy Dr
- 6793 Flanders Dr
- 36523 Cherry St
- 6416 Mayhews Landing Rd
- 36702 Olive St
- 36985 Walnut St
- 36075 Crystal Springs Dr
- 37051 Walnut St
- 6588 Flanders Dr
- 36593 Leone St
- 7843 Railroad Ave
- 35421 Cleremont Dr
- 35458 Orleans Dr
- 36290 Indian Wells Dr
- 36328 Indian Wells Dr
- 36354 Indian Wells Dr
- 36282 Indian Wells Dr
- 36305 Indian Wells Dr
- 36301 Indian Wells Dr
- 36372 Indian Wells Dr Unit IN LAW UNIT-
- 36372 Indian Wells Dr
- 36274 Indian Wells Dr
- 36287 Indian Wells Dr
- 36319 Indian Wells Dr
- 36263 Indian Wells Dr
- 36319 Beech Place
- 36311 Beech Place
- 36380 Indian Wells Dr
- 36266 Indian Wells Dr
- 36327 Beech Place
- 36373 Indian Wells Dr
- 36331 Indian Wells Dr
- 36258 Indian Wells Dr