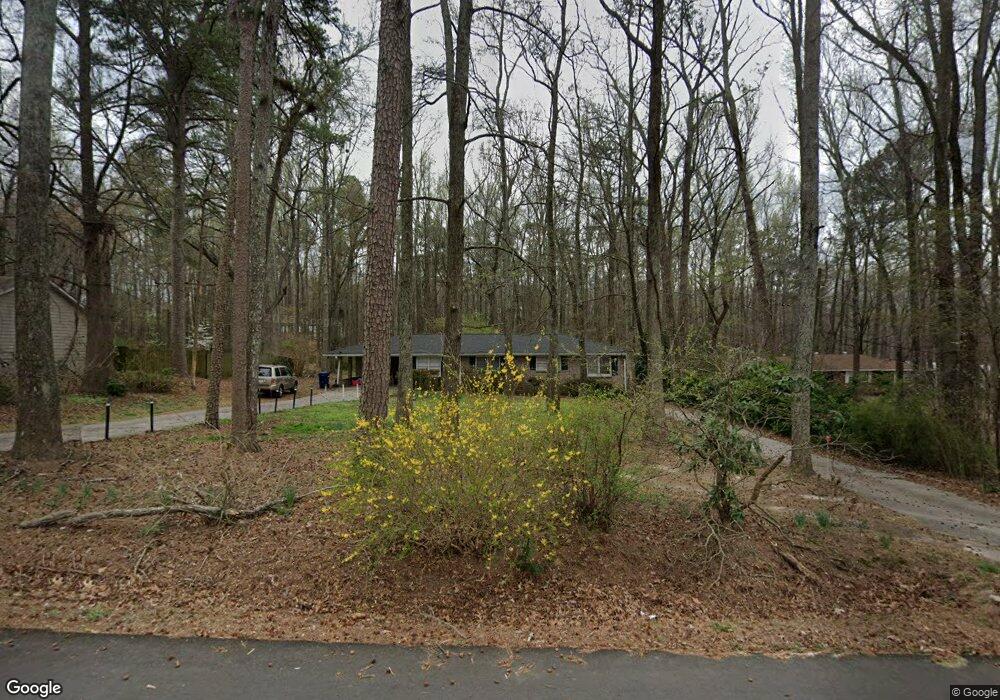
3632 Glenda St Lithia Springs, GA 30122
Lithia Springs NeighborhoodEstimated Value: $178,000 - $330,000
2
Beds
1
Bath
--
Sq Ft
0.68
Acres
About This Home
This home is located at 3632 Glenda St, Lithia Springs, GA 30122 and is currently estimated at $249,105. 3632 Glenda St is a home located in Douglas County with nearby schools including Annette Winn Elementary School, Turner Middle School, and Lithia Springs Comprehensive High School.
Ownership History
Date
Name
Owned For
Owner Type
Purchase Details
Closed on
Oct 26, 2018
Sold by
Denson Larry Gene
Bought by
Galan Angel
Current Estimated Value
Purchase Details
Closed on
Feb 5, 2010
Sold by
Powell Mary L
Bought by
Denson Larry G and Denson Mary L
Purchase Details
Closed on
May 27, 2009
Sold by
First Horizon Home Loans
Bought by
Powell Mary L
Purchase Details
Closed on
Jan 6, 2009
Sold by
Brooks Adaryl
Bought by
First Horizon Hm Ln
Purchase Details
Closed on
Oct 31, 2005
Sold by
Oglesby Buddy J
Bought by
Brooks Adaryl
Home Financials for this Owner
Home Financials are based on the most recent Mortgage that was taken out on this home.
Original Mortgage
$103,600
Interest Rate
7.75%
Mortgage Type
New Conventional
Purchase Details
Closed on
May 23, 1995
Sold by
Thompson Maggielena
Bought by
Oglesby Buddy
Create a Home Valuation Report for This Property
The Home Valuation Report is an in-depth analysis detailing your home's value as well as a comparison with similar homes in the area
Home Values in the Area
Average Home Value in this Area
Purchase History
| Date | Buyer | Sale Price | Title Company |
|---|---|---|---|
| Galan Angel | $82,450 | -- | |
| Denson Larry G | -- | -- | |
| Powell Mary L | $62,500 | -- | |
| First Horizon Hm Ln | $49,500 | -- | |
| Brooks Adaryl | $129,500 | -- | |
| Oglesby Buddy | $44,000 | -- |
Source: Public Records
Mortgage History
| Date | Status | Borrower | Loan Amount |
|---|---|---|---|
| Previous Owner | Brooks Adaryl | $103,600 |
Source: Public Records
Tax History Compared to Growth
Tax History
| Year | Tax Paid | Tax Assessment Tax Assessment Total Assessment is a certain percentage of the fair market value that is determined by local assessors to be the total taxable value of land and additions on the property. | Land | Improvement |
|---|---|---|---|---|
| 2024 | $2,143 | $68,120 | $11,200 | $56,920 |
| 2023 | $2,143 | $68,120 | $11,200 | $56,920 |
| 2022 | $1,403 | $43,080 | $6,400 | $36,680 |
| 2021 | $1,119 | $34,320 | $6,400 | $27,920 |
| 2020 | $1,138 | $34,320 | $6,400 | $27,920 |
| 2019 | $1,021 | $33,640 | $6,400 | $27,240 |
| 2018 | $1,011 | $32,480 | $6,400 | $26,080 |
| 2017 | $934 | $29,440 | $6,400 | $23,040 |
| 2016 | $851 | $26,360 | $5,920 | $20,440 |
| 2015 | $848 | $25,720 | $5,920 | $19,800 |
| 2014 | $820 | $24,400 | $5,920 | $18,480 |
| 2013 | -- | $24,360 | $5,920 | $18,440 |
Source: Public Records
Map
Nearby Homes
- 3020 Ben Blvd
- 6503 Jackie Ln
- 3667 Humphries Hill Rd
- 6163 Temple St
- 6358 Gordon St
- 3536 Perry Point
- 3705 Tate Place
- 6309 Wellington Way
- 6230 Kensington Ct
- 3636 Perry Point
- 6277 N Sweetwater Rd
- 6471 Ansley Blvd
- 6419 Arthur Dr
- 5954 Tate Dr
- 6531 Temple St
- 6538 N Sweetwater Rd
- 2030 Stonebrook Cir
- 5961 John St
- 3957 Evans Dr
- 5990 John St
- 3646 Glenda St
- 3620 Glenda St
- 3608 Glenda St
- 3639 Glenda St
- 3615 Glenda St
- 3651 Glenda St
- 3590 Glenda St
- 3665 Glenda St
- 0 Glenda St Unit 7603437
- 3599 Glenda St
- 6512 Jackie Ln
- 3570 Strickland St
- 3583 Glenda St
- 6513 Jackie Ln
- 3576 Glenda St
- 3675 Glenda St
- 3568 Glenda St
- 6510 Jackie Ln
- 6511 Jackie Ln
- 3685 Glenda St