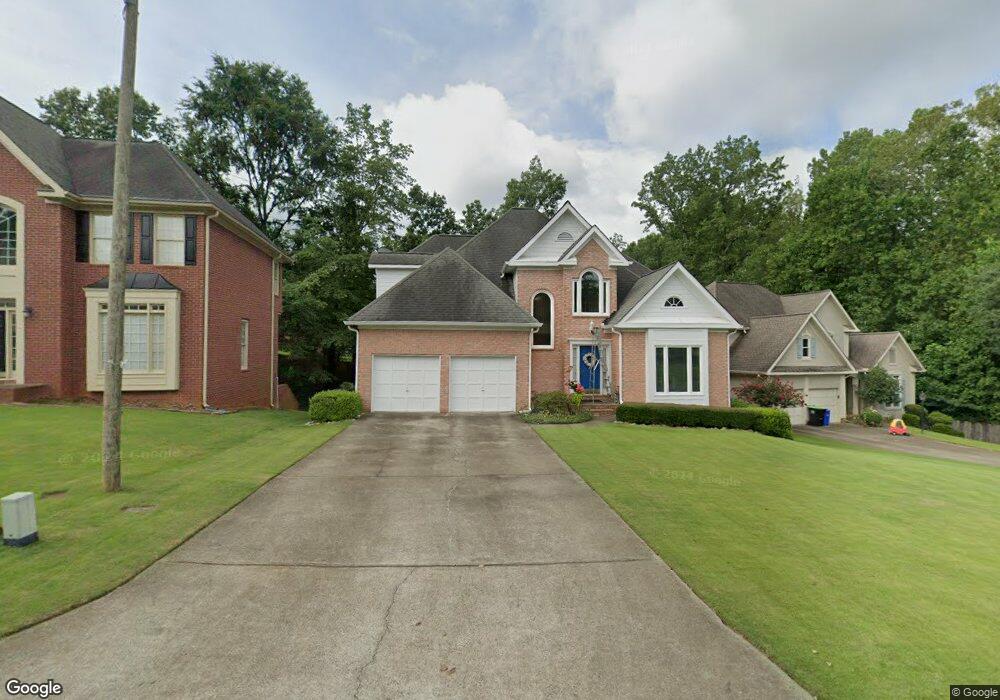
3632 Wyntering Trail Marietta, GA 30068
East Cobb NeighborhoodEstimated Value: $638,809 - $795,000
3
Beds
3
Baths
2,811
Sq Ft
$251/Sq Ft
Est. Value
About This Home
This home is located at 3632 Wyntering Trail, Marietta, GA 30068 and is currently estimated at $705,202, approximately $250 per square foot. 3632 Wyntering Trail is a home located in Cobb County with nearby schools including East Side Elementary School, Dodgen Middle School, and Walton High School.
Ownership History
Date
Name
Owned For
Owner Type
Purchase Details
Closed on
Jun 21, 1999
Sold by
Potts Timothy C and Potts Joann
Bought by
Womack David A and Womack Holly G
Current Estimated Value
Home Financials for this Owner
Home Financials are based on the most recent Mortgage that was taken out on this home.
Original Mortgage
$155,000
Outstanding Balance
$40,348
Interest Rate
7.13%
Mortgage Type
New Conventional
Estimated Equity
$664,854
Purchase Details
Closed on
Nov 13, 1996
Sold by
Fell Edgar Evonne
Bought by
Potts Timothy Joann
Purchase Details
Closed on
Oct 31, 1994
Sold by
Mccar Dev Corp
Bought by
Fell Edgar C Evonne E
Home Financials for this Owner
Home Financials are based on the most recent Mortgage that was taken out on this home.
Original Mortgage
$195,300
Interest Rate
8.68%
Create a Home Valuation Report for This Property
The Home Valuation Report is an in-depth analysis detailing your home's value as well as a comparison with similar homes in the area
Home Values in the Area
Average Home Value in this Area
Purchase History
| Date | Buyer | Sale Price | Title Company |
|---|---|---|---|
| Womack David A | $238,000 | -- | |
| Potts Timothy Joann | $219,000 | -- | |
| Fell Edgar C Evonne E | $217,000 | -- |
Source: Public Records
Mortgage History
| Date | Status | Borrower | Loan Amount |
|---|---|---|---|
| Open | Womack David A | $155,000 | |
| Previous Owner | Fell Edgar C Evonne E | $195,300 | |
| Closed | Potts Timothy Joann | $0 |
Source: Public Records
Tax History Compared to Growth
Tax History
| Year | Tax Paid | Tax Assessment Tax Assessment Total Assessment is a certain percentage of the fair market value that is determined by local assessors to be the total taxable value of land and additions on the property. | Land | Improvement |
|---|---|---|---|---|
| 2025 | $6,299 | $269,396 | $70,000 | $199,396 |
| 2024 | $6,049 | $257,628 | $56,000 | $201,628 |
| 2023 | $3,817 | $179,760 | $36,000 | $143,760 |
| 2022 | $4,394 | $179,760 | $36,000 | $143,760 |
| 2021 | $4,394 | $179,760 | $36,000 | $143,760 |
| 2020 | $4,252 | $173,296 | $36,000 | $137,296 |
| 2019 | $4,252 | $173,296 | $36,000 | $137,296 |
| 2018 | $4,252 | $173,296 | $36,000 | $137,296 |
| 2017 | $4,140 | $173,296 | $36,000 | $137,296 |
| 2016 | $3,712 | $153,504 | $36,000 | $117,504 |
| 2015 | $3,966 | $161,584 | $36,000 | $125,584 |
| 2014 | $2,865 | $111,360 | $0 | $0 |
Source: Public Records
Map
Nearby Homes
- 3700 Robinson Rd NE
- 3506 Clubland Dr Unit 6
- 1257 Independence Way
- 3769 High Green Dr
- 3542 Clubland Dr
- 3570 Brighton Place
- 3792 Raccoon Run
- 1200 Mitsy Forest Dr NE
- 718 Trevett Way
- 3760 Creekstone Way
- 4121 Fawn Ct
- 1195 Fielding Way
- 1164 Fairfield Dr
- 3442 Fox Hollow Dr
- 870 Muirfield Trace
- 3830 Valley Green Dr
- 0 Old Canton Rd NE Unit 10567243
- 0 Old Canton Rd NE Unit 7617214
- 1038 Seven Springs Cir
- 3636 Wyntering Trail
- 3628 Wyntering Trail
- 3640 Wyntering Trail
- 3624 Wyntering Trail
- 3708 Robinson Walk Ct
- 3619 Wyntering Trail
- 3712 Robinson Walk Ct
- 3620 Wyntering Trail
- 3644 Wyntering Trail
- 3621 Wyntering Trail
- 3615 Wyntering Trail
- 0 Wyntering Trail Unit 7533195
- 0 Wyntering Trail Unit 7320851
- 0 Wyntering Trail Unit 3251381
- 0 Wyntering Trail Unit 8688077
- 0 Wyntering Trail Unit 8632792
- 0 Wyntering Trail Unit 8248455
- 0 Wyntering Trail Unit 8785434
- 3706 Robinson Walk Ct Unit 1
- 3616 Wyntering Trail