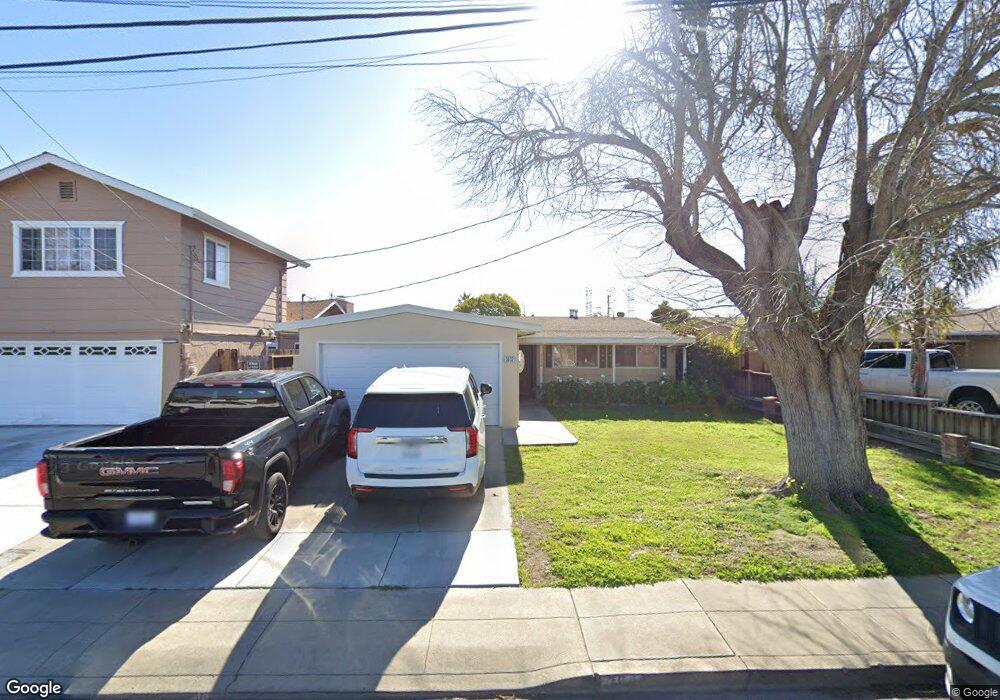
3632 Yorktown Rd Fremont, CA 94538
Grimmer NeighborhoodEstimated Value: $1,218,000 - $1,515,000
4
Beds
2
Baths
1,340
Sq Ft
$1,057/Sq Ft
Est. Value
About This Home
This home is located at 3632 Yorktown Rd, Fremont, CA 94538 and is currently estimated at $1,416,499, approximately $1,057 per square foot. 3632 Yorktown Rd is a home located in Alameda County with nearby schools including E. M. Grimmer Elementary School, John M. Horner Junior High School, and Irvington High School.
Ownership History
Date
Name
Owned For
Owner Type
Purchase Details
Closed on
Sep 5, 2025
Sold by
Liu Fang Living Trust and Fang Yu
Bought by
Xian Ting Llc
Current Estimated Value
Purchase Details
Closed on
May 21, 2015
Sold by
Fang Yu and Liu Lin
Bought by
The Liu Fang Living Trust
Purchase Details
Closed on
Jun 7, 2012
Sold by
Matarlo Vincent Roy C and Matarlo Janette M
Bought by
Fang Yu and Liu Lin
Purchase Details
Closed on
May 6, 1999
Sold by
Hoag Thomas F
Bought by
Matario Vincent Roy C and Matario Marie Janette M
Home Financials for this Owner
Home Financials are based on the most recent Mortgage that was taken out on this home.
Original Mortgage
$199,200
Interest Rate
6.96%
Mortgage Type
Stand Alone First
Purchase Details
Closed on
Nov 19, 1993
Sold by
Smith Elizabeth R
Bought by
Hoag Thomas Frank
Home Financials for this Owner
Home Financials are based on the most recent Mortgage that was taken out on this home.
Original Mortgage
$183,997
Interest Rate
6.85%
Mortgage Type
Assumption
Create a Home Valuation Report for This Property
The Home Valuation Report is an in-depth analysis detailing your home's value as well as a comparison with similar homes in the area
Home Values in the Area
Average Home Value in this Area
Purchase History
| Date | Buyer | Sale Price | Title Company |
|---|---|---|---|
| Xian Ting Llc | -- | None Listed On Document | |
| The Liu Fang Living Trust | -- | None Available | |
| Fang Yu | $350,000 | Placer Title Company | |
| Matario Vincent Roy C | $249,000 | Fidelity National Title Co | |
| Hoag Thomas Frank | $184,000 | Chicago Title Company |
Source: Public Records
Mortgage History
| Date | Status | Borrower | Loan Amount |
|---|---|---|---|
| Previous Owner | Matario Vincent Roy C | $199,200 | |
| Previous Owner | Hoag Thomas Frank | $183,997 | |
| Closed | Matario Vincent Roy C | $37,350 |
Source: Public Records
Tax History Compared to Growth
Tax History
| Year | Tax Paid | Tax Assessment Tax Assessment Total Assessment is a certain percentage of the fair market value that is determined by local assessors to be the total taxable value of land and additions on the property. | Land | Improvement |
|---|---|---|---|---|
| 2025 | $5,709 | $439,595 | $131,878 | $307,717 |
| 2024 | $5,709 | $430,978 | $129,293 | $301,685 |
| 2023 | $5,546 | $422,530 | $126,759 | $295,771 |
| 2022 | $5,460 | $414,245 | $124,273 | $289,972 |
| 2021 | $5,331 | $406,125 | $121,837 | $284,288 |
| 2020 | $5,296 | $401,964 | $120,589 | $281,375 |
| 2019 | $5,239 | $394,085 | $118,225 | $275,860 |
| 2018 | $5,135 | $386,361 | $115,908 | $270,453 |
| 2017 | $5,008 | $378,787 | $113,636 | $265,151 |
| 2016 | $4,916 | $371,360 | $111,408 | $259,952 |
| 2015 | $4,844 | $365,784 | $109,735 | $256,049 |
| 2014 | $4,756 | $358,620 | $107,586 | $251,034 |
Source: Public Records
Map
Nearby Homes
- 42759 Newport Dr
- 261 Manitoba Green Unit 261
- 262 Manitoba Green
- 257 Manitoba Green
- 208 Manitoba Terrace
- 43580 Homestead Ct
- 42932 Peachwood St
- 42747 Wixon Dr
- 2450 Euclid Place
- 4309 Bora Ave
- 3872 Wildflower Common Unit 27
- 3923 Wildflower Common Unit 19
- 48 Eagle Green
- 41882 Gifford St
- 3493 Router Common
- 3470 Router Common
- 3388 Router Common
- 43163 Grimmer Terrace
- 3918 Fossano Common
- 2164 Ocaso Camino
- 3620 Yorktown Rd
- 3644 Yorktown Rd
- 3566 Yorktown Rd
- 3656 Yorktown Rd
- 3621 Independence Rd
- 3633 Independence Rd
- 3579 Independence Rd
- 3631 Yorktown Rd
- 3645 Independence Rd
- 3567 Independence Rd
- 3554 Yorktown Rd
- 3668 Yorktown Rd
- 43344 Charleston Way
- 3657 Independence Rd
- 43333 Continental Dr
- 3555 Independence Rd
- 3680 Yorktown Rd
- 3542 Yorktown Rd
- 43332 Charleston Way
- 3553 Yorktown Rd