Estimated Value: $193,000 - $225,000
2
Beds
1
Bath
1,220
Sq Ft
$168/Sq Ft
Est. Value
About This Home
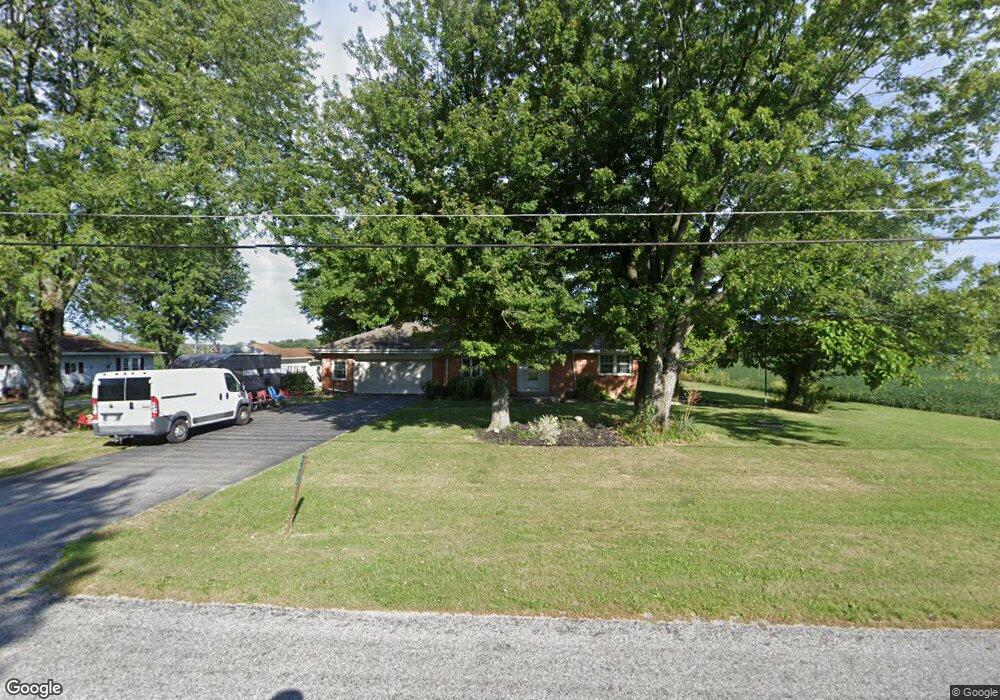
This home is located at 3633 N Dixie Hwy, Lima, OH 45801 and is currently estimated at $205,163, approximately $168 per square foot. 3633 N Dixie Hwy is a home located in Allen County with nearby schools including Bath Elementary School, Bath Middle School, and Bath High School.
Ownership History
Date
Name
Owned For
Owner Type
Purchase Details
Closed on
May 2, 2014
Sold by
Ackerman Brock A and Ackerman Shannon L
Bought by
Mason Jennifer K
Current Estimated Value
Home Financials for this Owner
Home Financials are based on the most recent Mortgage that was taken out on this home.
Original Mortgage
$97,956
Outstanding Balance
$74,654
Interest Rate
4.33%
Mortgage Type
Future Advance Clause Open End Mortgage
Estimated Equity
$130,509
Purchase Details
Closed on
Jun 4, 2008
Sold by
Sibold Robert L and Sibold Tanya M
Bought by
Ackerman Brock A
Home Financials for this Owner
Home Financials are based on the most recent Mortgage that was taken out on this home.
Original Mortgage
$93,000
Interest Rate
6.01%
Mortgage Type
Purchase Money Mortgage
Purchase Details
Closed on
Dec 13, 2007
Sold by
Moyer Edith L and Klosterman Vicki
Bought by
Sibold Robert L and Sibold Tanya M
Purchase Details
Closed on
Jan 1, 1990
Bought by
Moyer Edith L
Create a Home Valuation Report for This Property
The Home Valuation Report is an in-depth analysis detailing your home's value as well as a comparison with similar homes in the area
Purchase History
| Date | Buyer | Sale Price | Title Company |
|---|---|---|---|
| Mason Jennifer K | $95,000 | None Available | |
| Ackerman Brock A | $99,000 | None Available | |
| Sibold Robert L | $50,000 | None Available | |
| Moyer Edith L | -- | -- |
Source: Public Records
Mortgage History
| Date | Status | Borrower | Loan Amount |
|---|---|---|---|
| Open | Mason Jennifer K | $97,956 | |
| Previous Owner | Ackerman Brock A | $93,000 |
Source: Public Records
Tax History Compared to Growth
Tax History
| Year | Tax Paid | Tax Assessment Tax Assessment Total Assessment is a certain percentage of the fair market value that is determined by local assessors to be the total taxable value of land and additions on the property. | Land | Improvement |
|---|---|---|---|---|
| 2024 | $2,574 | $50,300 | $6,440 | $43,860 |
| 2023 | $2,287 | $42,630 | $5,460 | $37,170 |
| 2022 | $2,300 | $42,630 | $5,460 | $37,170 |
| 2021 | $2,306 | $42,630 | $5,460 | $37,170 |
| 2020 | $2,300 | $38,360 | $5,250 | $33,110 |
| 2019 | $2,300 | $38,360 | $5,250 | $33,110 |
| 2018 | $2,154 | $38,360 | $5,250 | $33,110 |
| 2017 | $2,069 | $34,060 | $5,250 | $28,810 |
| 2016 | $2,029 | $34,060 | $5,250 | $28,810 |
| 2015 | $1,883 | $34,060 | $5,250 | $28,810 |
| 2014 | $1,883 | $29,790 | $5,250 | $24,540 |
| 2013 | $1,884 | $29,790 | $5,250 | $24,540 |
Source: Public Records
Map
Nearby Homes
- 0 N Dixie Hwy Unit 300253
- 4619 N Thayer Rd
- 108 Highland Lakes Dr
- 5496 Sandusky Rd
- 6431 Couples Ln
- 6476 Mickelson Ln
- 5025 N Cool Rd
- 000 Napoleon Rd
- N Dixie Hwy
- 5817 N Dixie Hwy
- 1656 Stewart Rd
- 5544 Reservoir Rd
- 7700 Mehaffey Rd
- 307 Ridge Crest Cir
- 5606 Reservoir Rd
- 115 Oakview Ct
- 1503 Findlay Rd Unit Lot 6
- 819 Canyon Dr
- 102 E Pearl St
- 485 S Mumaugh Rd