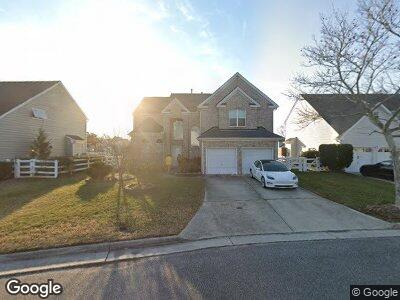
3633 Storm Bird Loop Virginia Beach, VA 23453
Green Run NeighborhoodEstimated Value: $502,000 - $549,000
4
Beds
3
Baths
2,483
Sq Ft
$211/Sq Ft
Est. Value
About This Home
This home is located at 3633 Storm Bird Loop, Virginia Beach, VA 23453 and is currently estimated at $523,846, approximately $210 per square foot. 3633 Storm Bird Loop is a home located in Virginia Beach City with nearby schools including Landstown Elementary School, Landstown Middle School, and Landstown High School.
Ownership History
Date
Name
Owned For
Owner Type
Purchase Details
Closed on
Apr 12, 2011
Sold by
Fennell Stacy A
Bought by
Trinh Tung
Current Estimated Value
Home Financials for this Owner
Home Financials are based on the most recent Mortgage that was taken out on this home.
Original Mortgage
$263,155
Interest Rate
4.75%
Mortgage Type
FHA
Purchase Details
Closed on
Jan 13, 2006
Sold by
Vo Philip
Bought by
Fennell Stacy
Home Financials for this Owner
Home Financials are based on the most recent Mortgage that was taken out on this home.
Original Mortgage
$286,400
Interest Rate
6.31%
Mortgage Type
New Conventional
Purchase Details
Closed on
Jun 30, 2000
Sold by
Kroll Residential Inc
Bought by
Cortes Manuelita T
Home Financials for this Owner
Home Financials are based on the most recent Mortgage that was taken out on this home.
Original Mortgage
$130,000
Interest Rate
8.55%
Create a Home Valuation Report for This Property
The Home Valuation Report is an in-depth analysis detailing your home's value as well as a comparison with similar homes in the area
Home Values in the Area
Average Home Value in this Area
Purchase History
| Date | Buyer | Sale Price | Title Company |
|---|---|---|---|
| Trinh Tung | $270,000 | -- | |
| Fennell Stacy | $358,000 | -- | |
| Cortes Manuelita T | $175,175 | -- |
Source: Public Records
Mortgage History
| Date | Status | Borrower | Loan Amount |
|---|---|---|---|
| Open | Trinh Tung | $241,000 | |
| Closed | Trinh Tung | $256,778 | |
| Closed | Trinh Tung | $263,155 | |
| Previous Owner | Fennell Stacy | $286,400 | |
| Previous Owner | Cortes Manuelita T | $130,000 |
Source: Public Records
Tax History Compared to Growth
Tax History
| Year | Tax Paid | Tax Assessment Tax Assessment Total Assessment is a certain percentage of the fair market value that is determined by local assessors to be the total taxable value of land and additions on the property. | Land | Improvement |
|---|---|---|---|---|
| 2024 | $4,368 | $450,300 | $160,000 | $290,300 |
| 2023 | $4,451 | $449,600 | $157,200 | $292,400 |
| 2022 | $3,976 | $401,600 | $131,000 | $270,600 |
| 2021 | $3,523 | $355,900 | $118,000 | $237,900 |
| 2020 | $3,418 | $335,900 | $110,000 | $225,900 |
| 2019 | $3,374 | $323,200 | $110,000 | $213,200 |
| 2018 | $3,240 | $323,200 | $110,000 | $213,200 |
| 2017 | $3,177 | $316,900 | $112,000 | $204,900 |
| 2016 | $3,111 | $314,200 | $109,000 | $205,200 |
| 2015 | $2,964 | $299,400 | $105,000 | $194,400 |
| 2014 | $2,622 | $298,800 | $110,100 | $188,700 |
Source: Public Records
Map
Nearby Homes
- 3508 Criollo Dr
- 3528 Light Horse Loop
- 3612 Purebred Dr
- 3669 Purebred Dr
- 1728 Eleni Ct
- 3445 Poppy Crescent
- 1520 Saddle Ct
- 3513 Brigita Ct
- 3518 Argo Ct
- 3554 Brigita Ct
- 3512 Poppy Crescent
- 3708 Canadian Arch
- 3416 Crimson Holly Ct
- 1521 Garland Way
- 3400 Petunia Crescent
- 3703 Sylvan Ln
- 3613 Wetherington Dr Unit 101
- 3613 Wetherington Dr Unit 103
- 3309 Weeping Willow Ln
- 1248 Gladiola Crescent
- 3633 Storm Bird Loop
- 3629 Storm Bird Loop
- 3637 Storm Bird Loop
- 3641 Storm Bird Loop
- 3625 Storm Bird Loop
- 3632 Storm Bird Loop
- 3645 Storm Bird Loop
- 3620 Storm Bird Loop
- 3528 Celtic Dr
- 3621 Storm Bird Loop
- 3640 Storm Bird Loop
- 3721 Light Horse Loop
- 3717 Light Horse Loop
- 3644 Storm Bird Loop
- 3725 Light Horse Loop
- 3713 Light Horse Loop
- 3649 Storm Bird Loop
- 3729 Light Horse Loop
- 3709 Light Horse Loop
- 3617 Storm Bird Loop